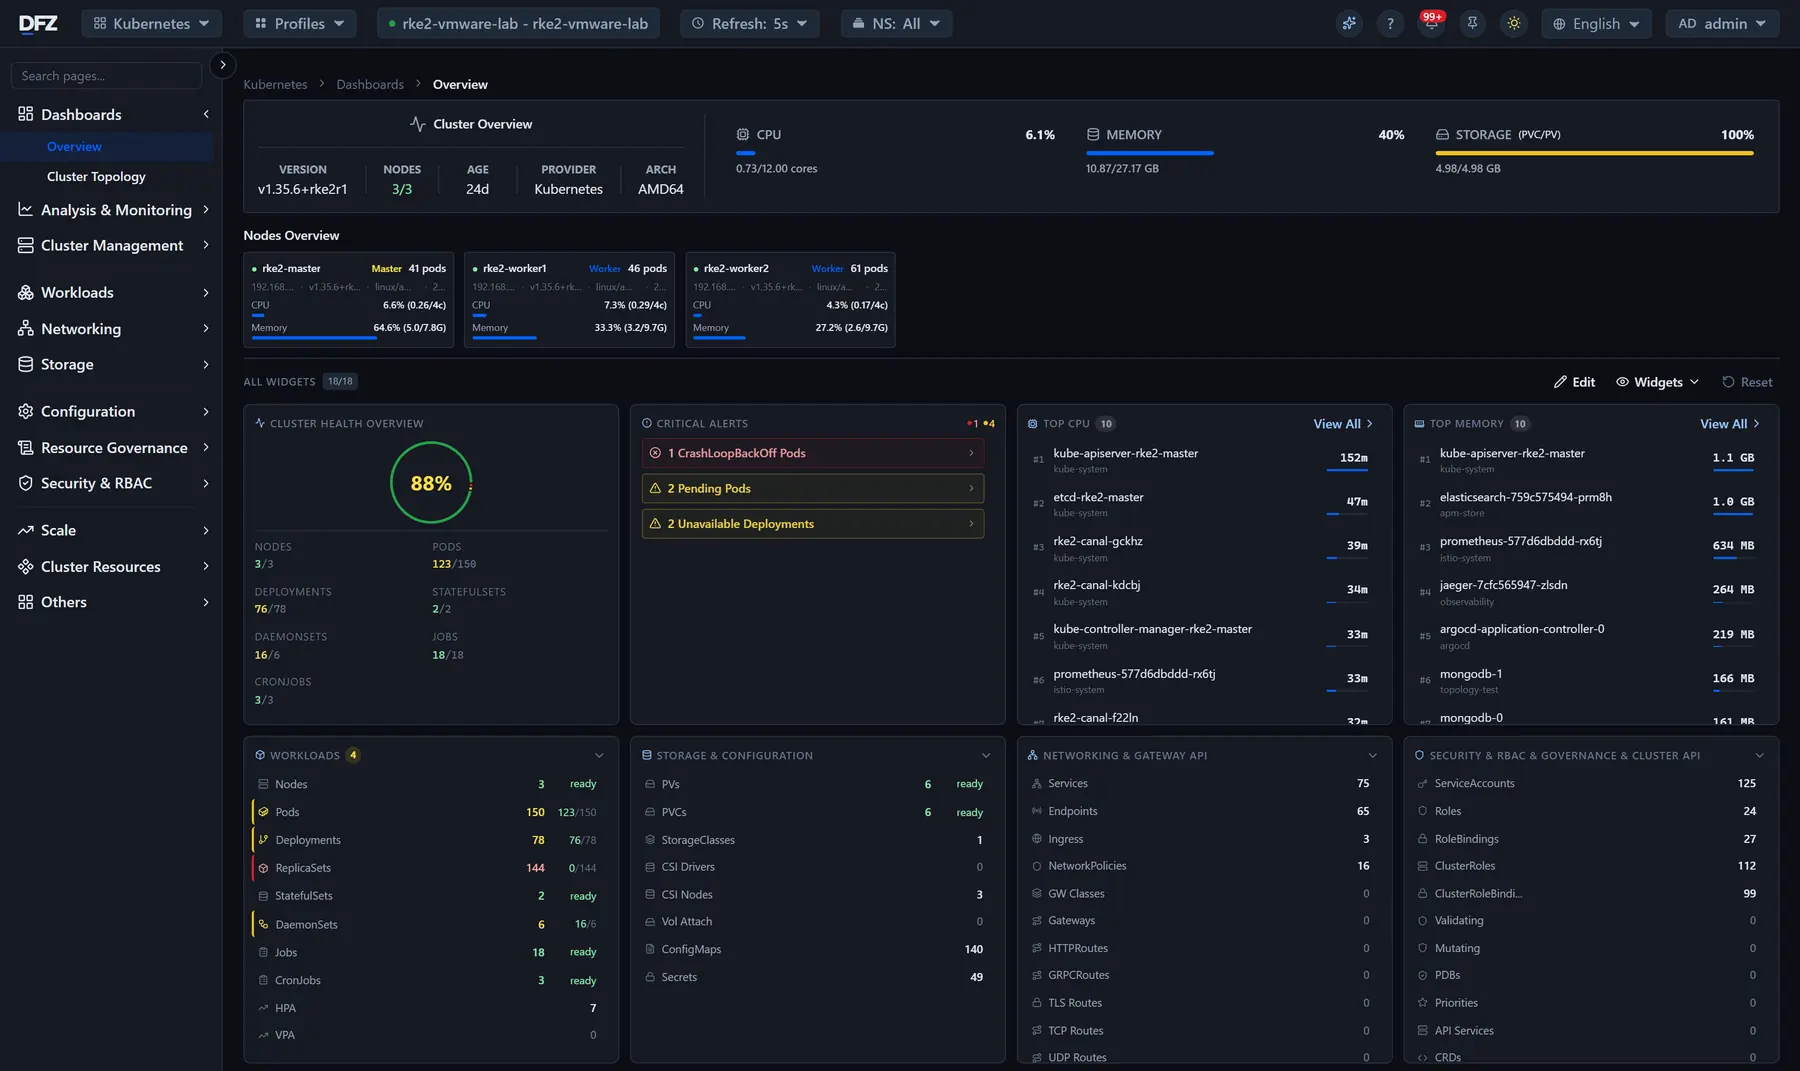
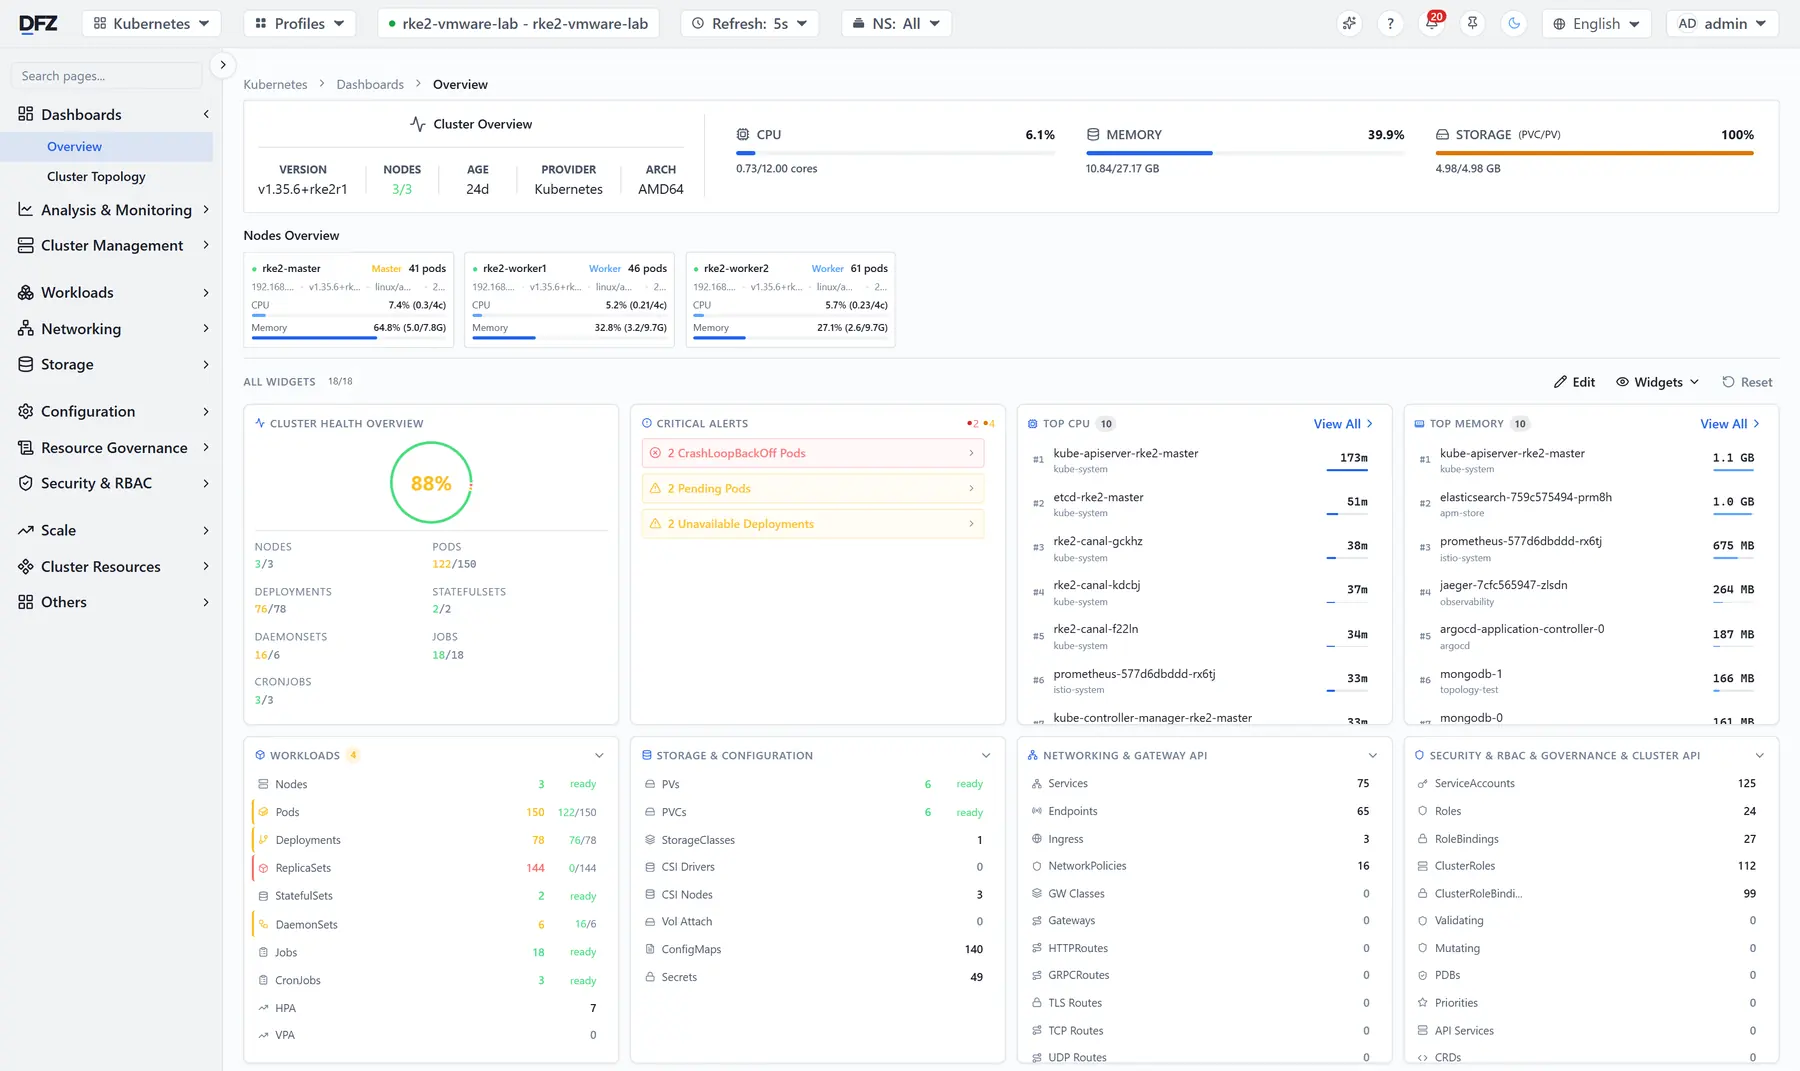
The whole cluster at a glance
Health as a single ratio, the problems happening right now beside it, then workload, storage and networking summaries.
Installs and manages Kubernetes. Manages Docker. Monitors the servers underneath. Tells your team when something goes wrong.
One product, one install: every team can monitor and manage its own applications.
Real screens from a running cluster. Switch the theme in the header — the screenshots follow.
Health as a single ratio, the problems happening right now beside it, then workload, storage and networking summaries.
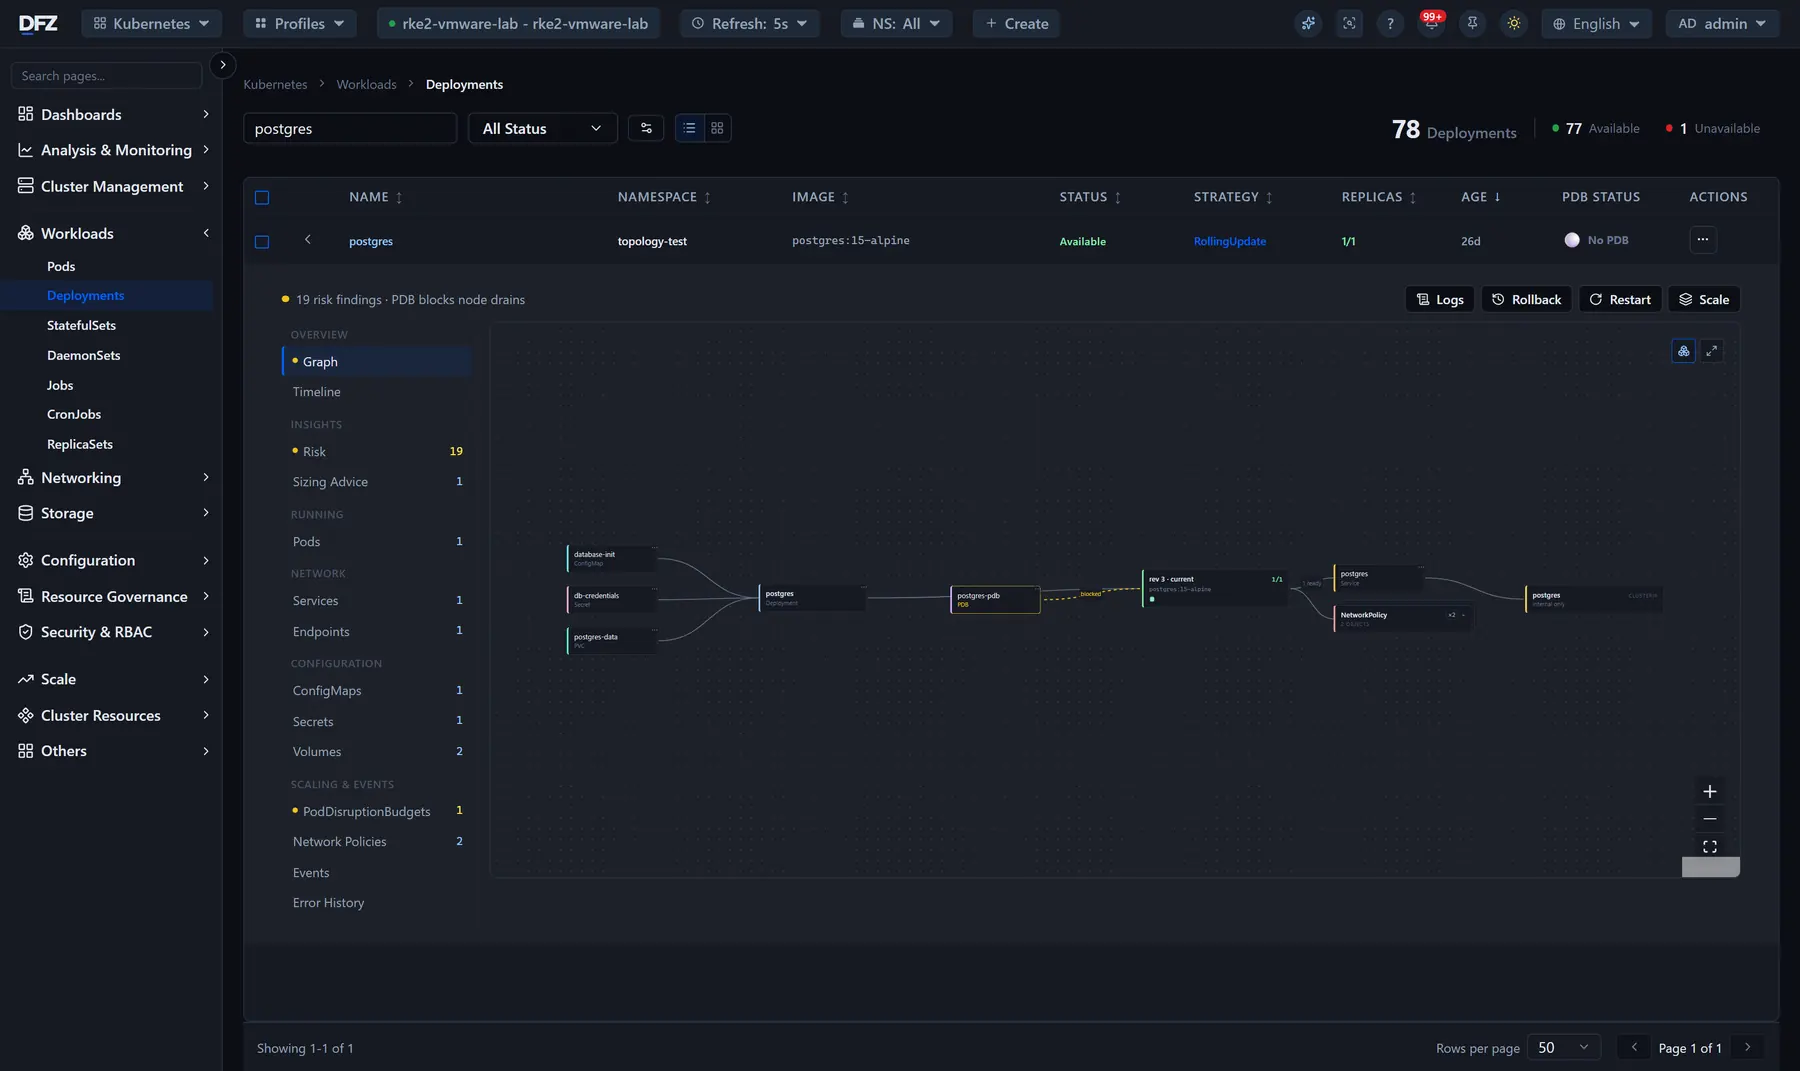
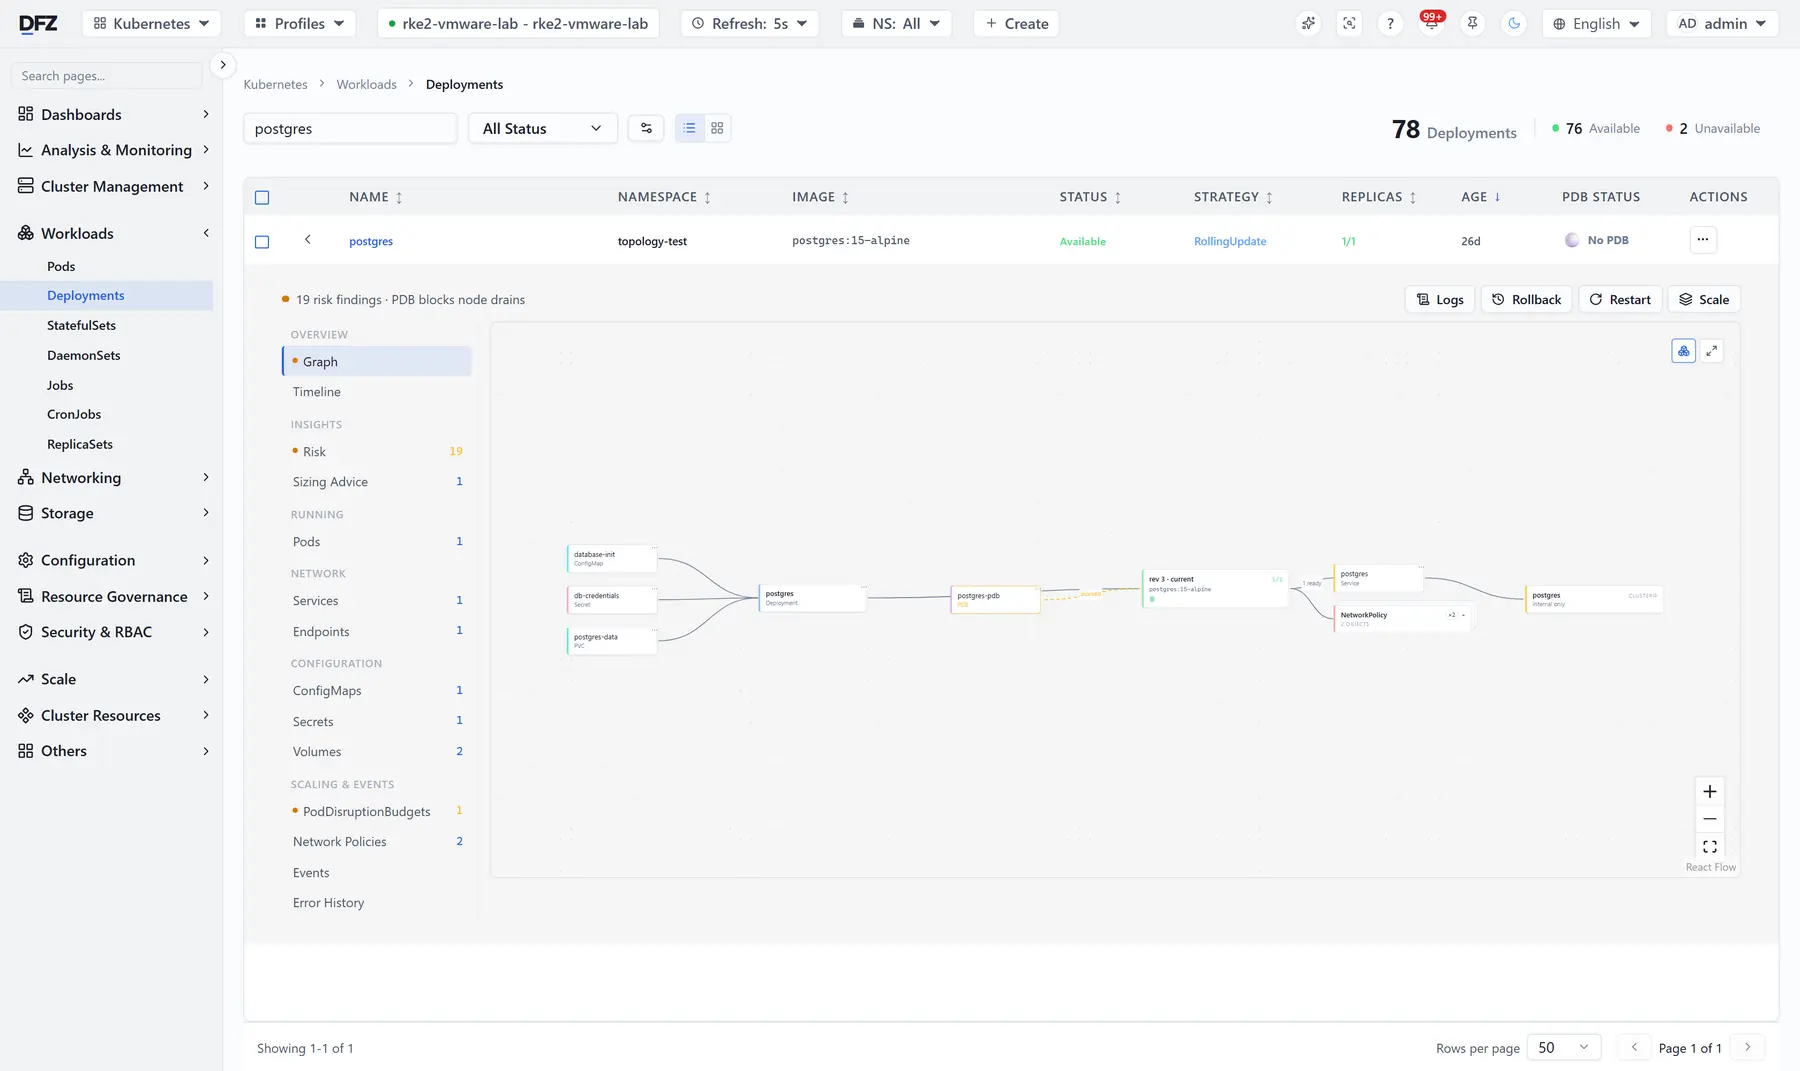
Open a deployment: its ConfigMap, Secret, volume claim, disruption budget, services and network policies in one diagram — with risk findings, revisions and event history beside it.
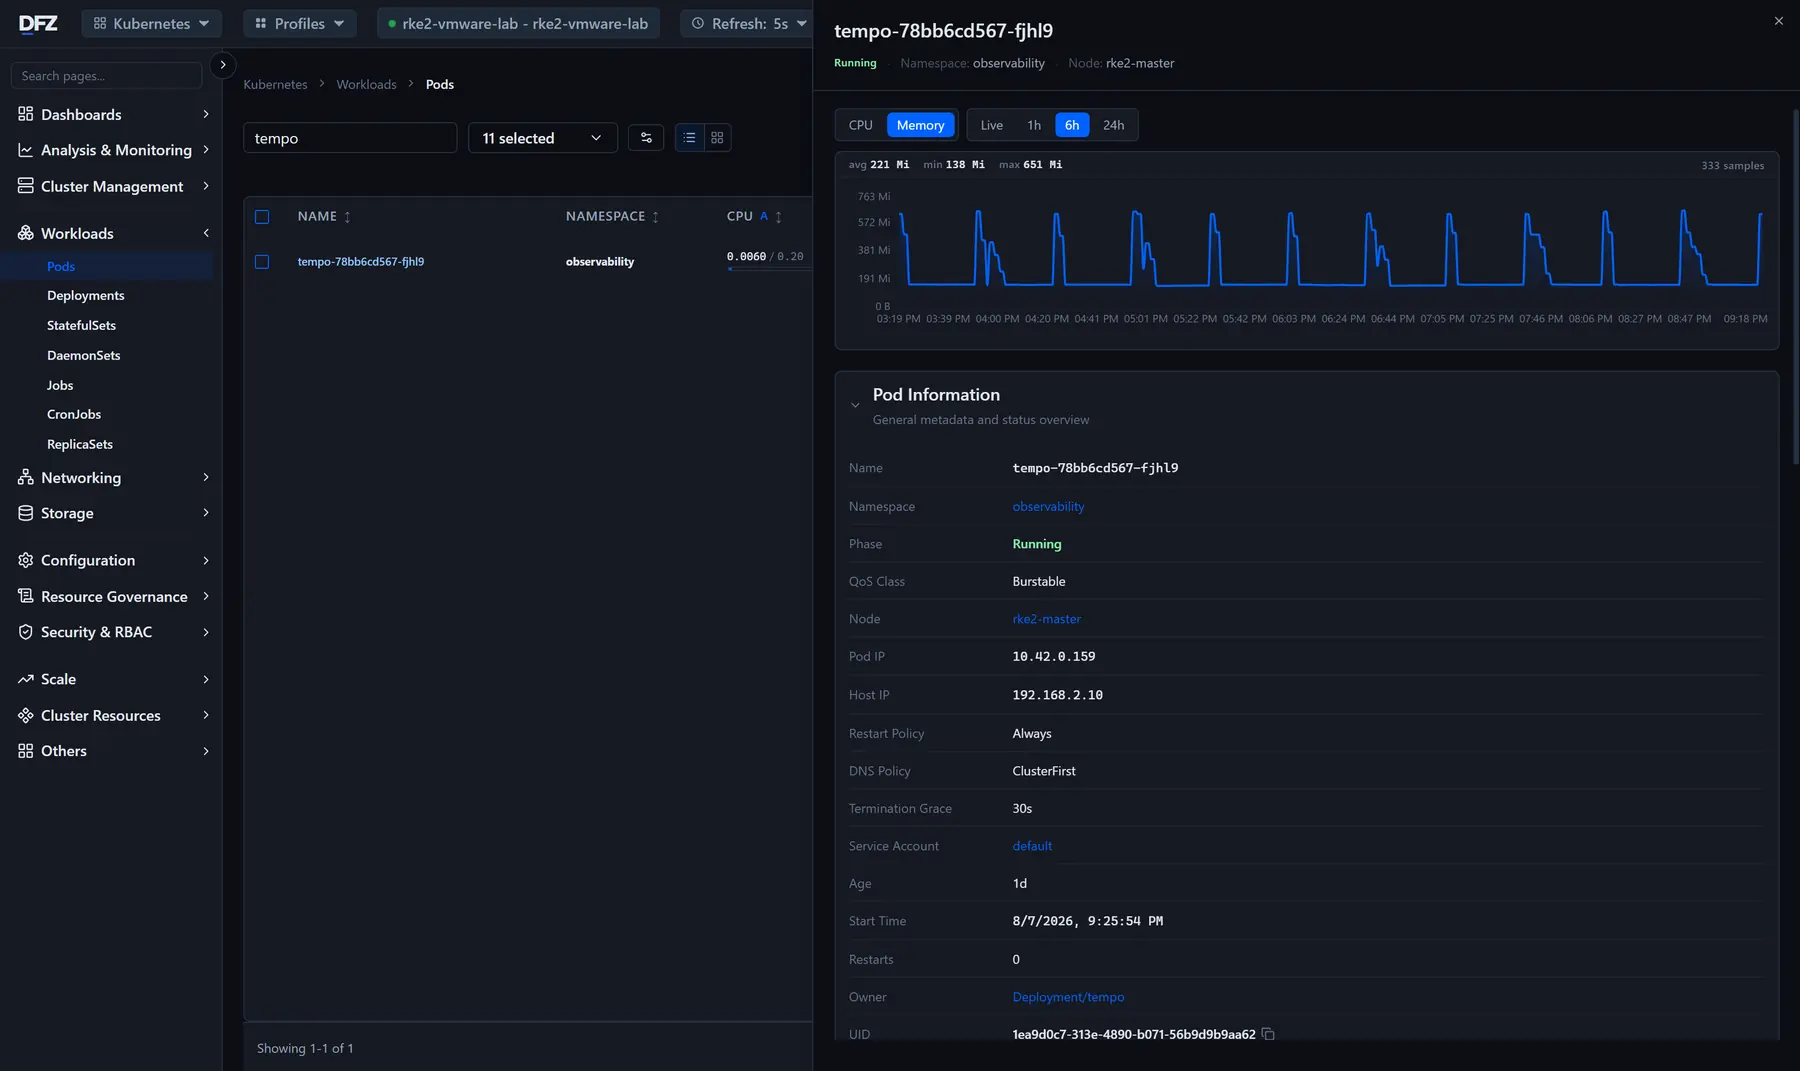
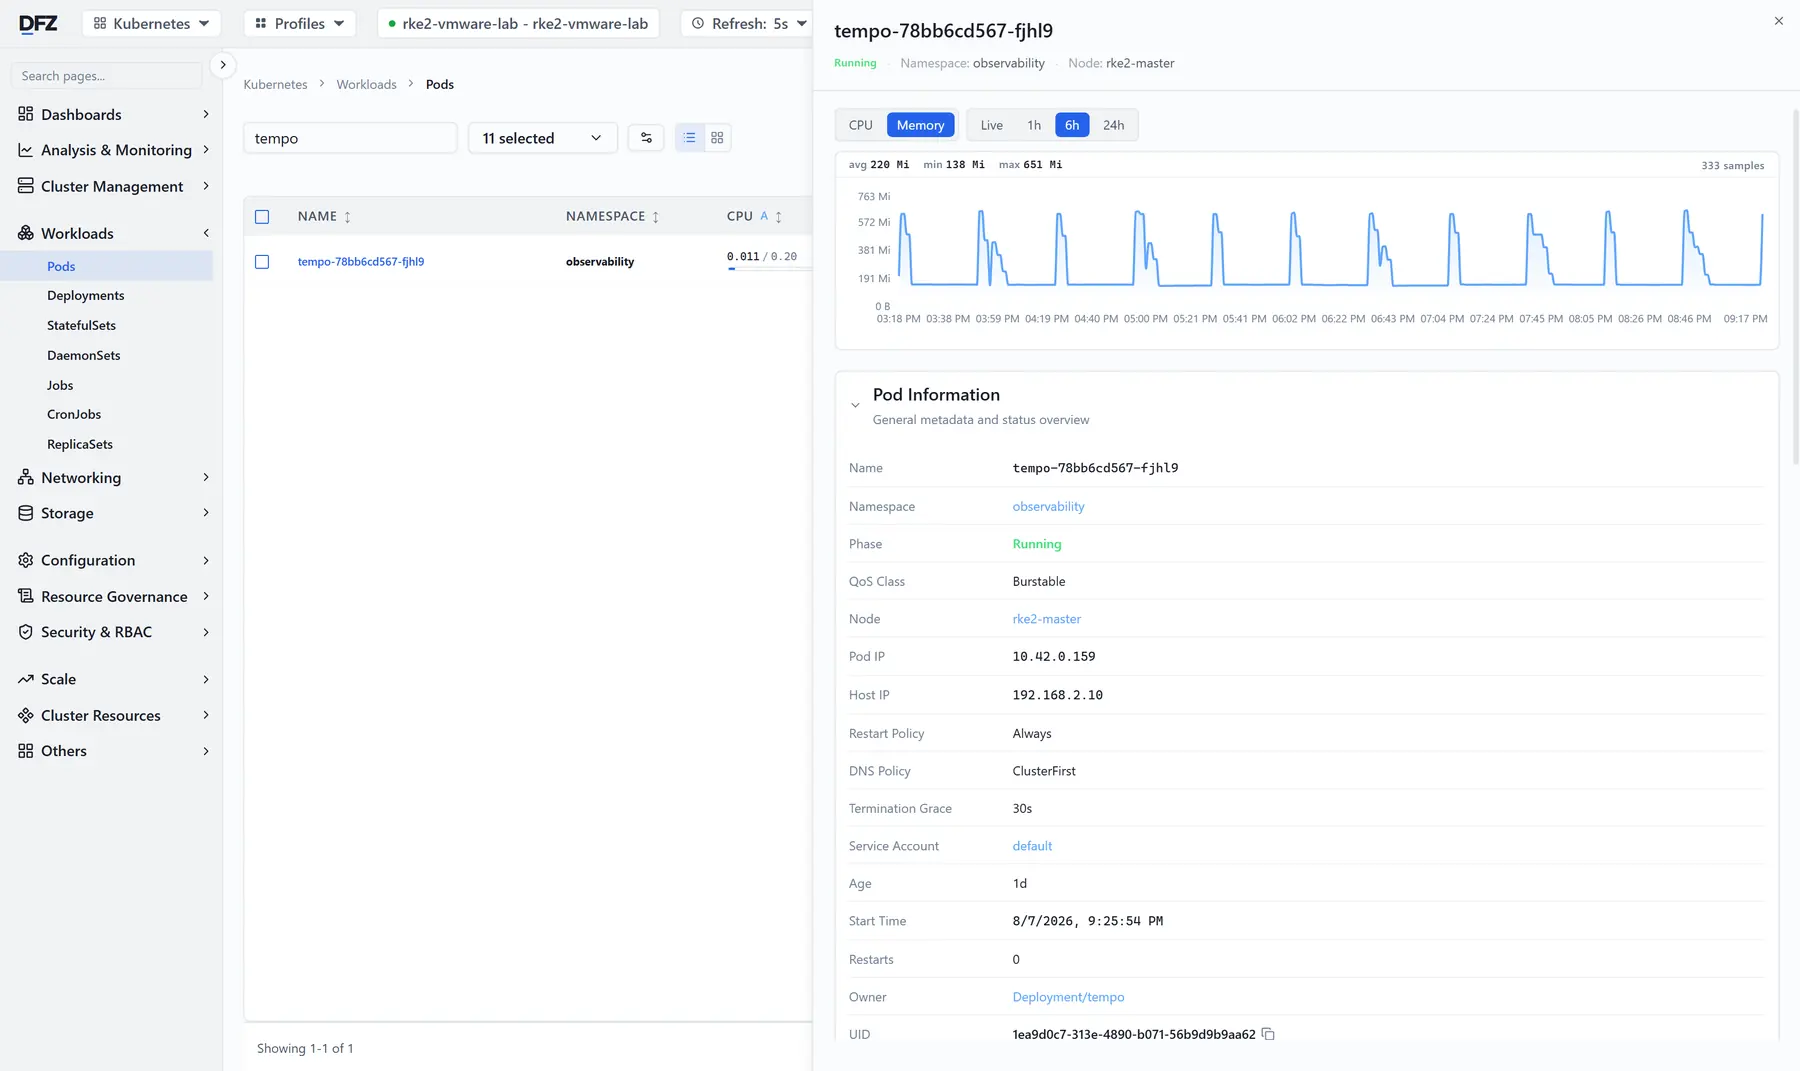
Open a pod: processor and memory over the range you pick, with average and peak. Under the chart sit metadata, conditions, event history, containers and volumes.
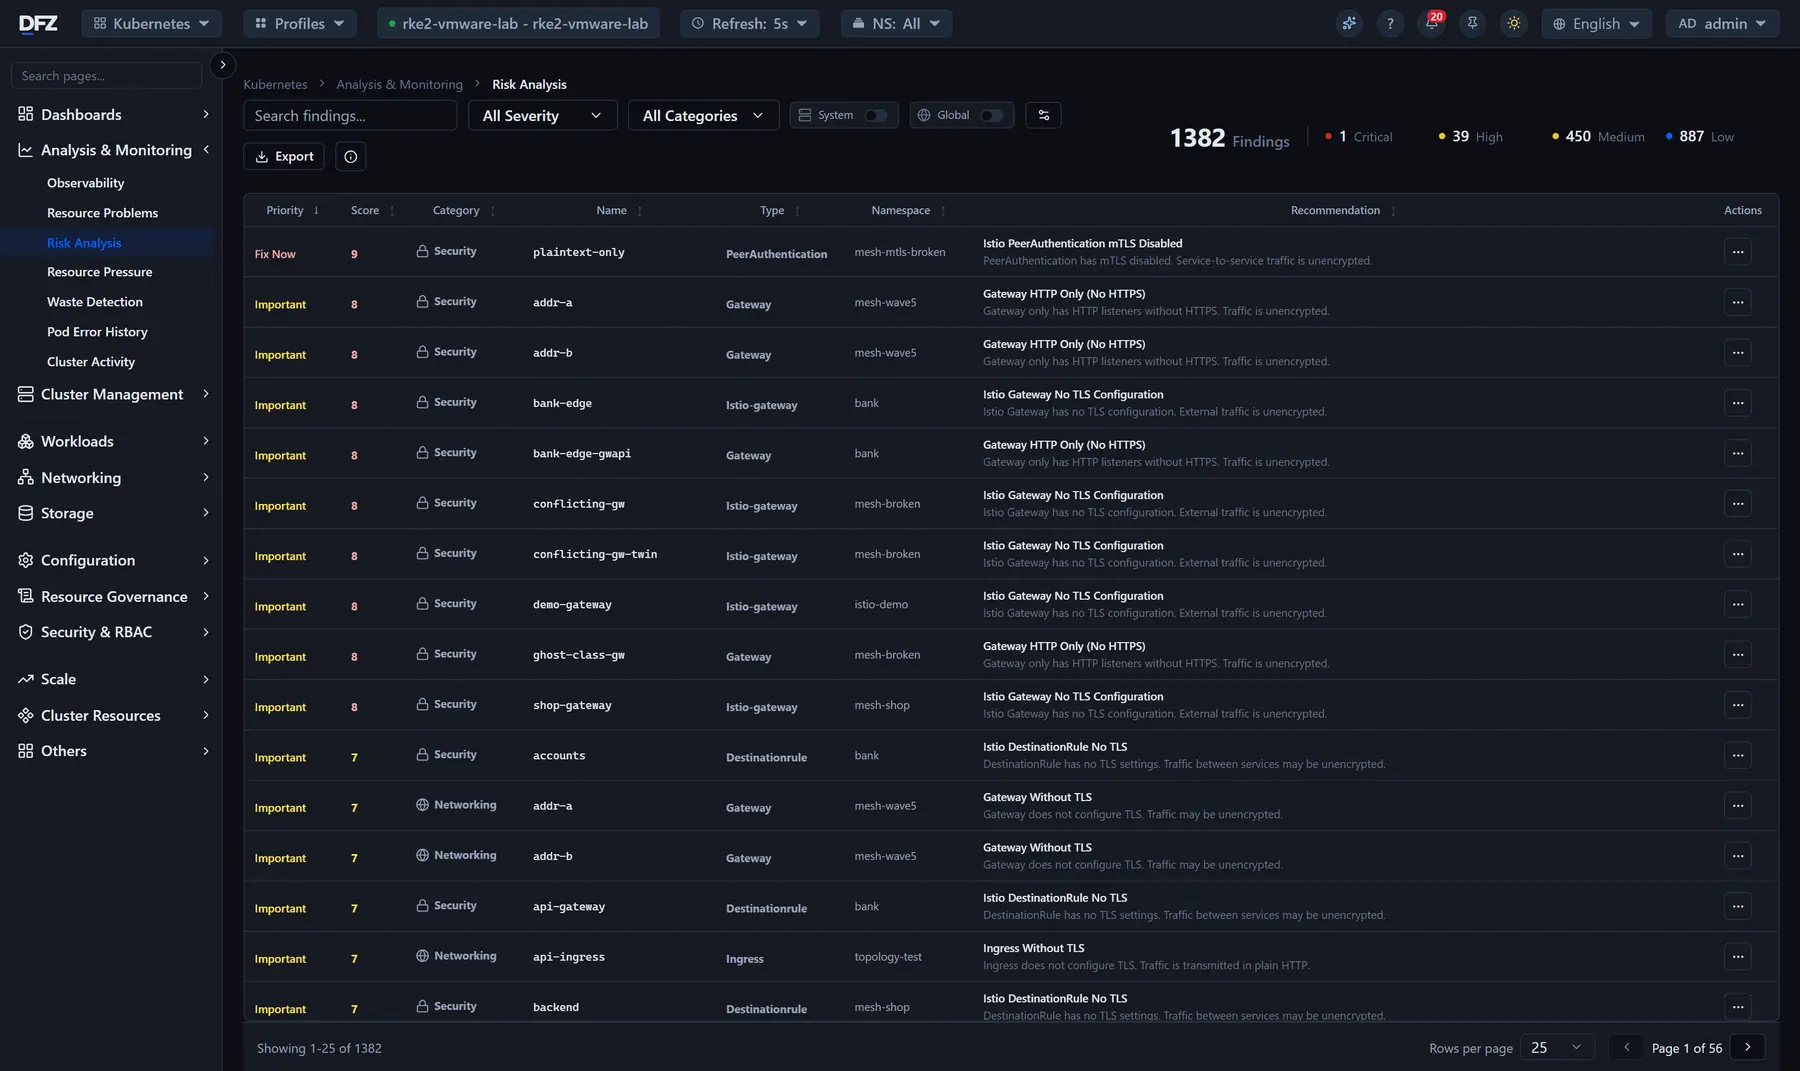
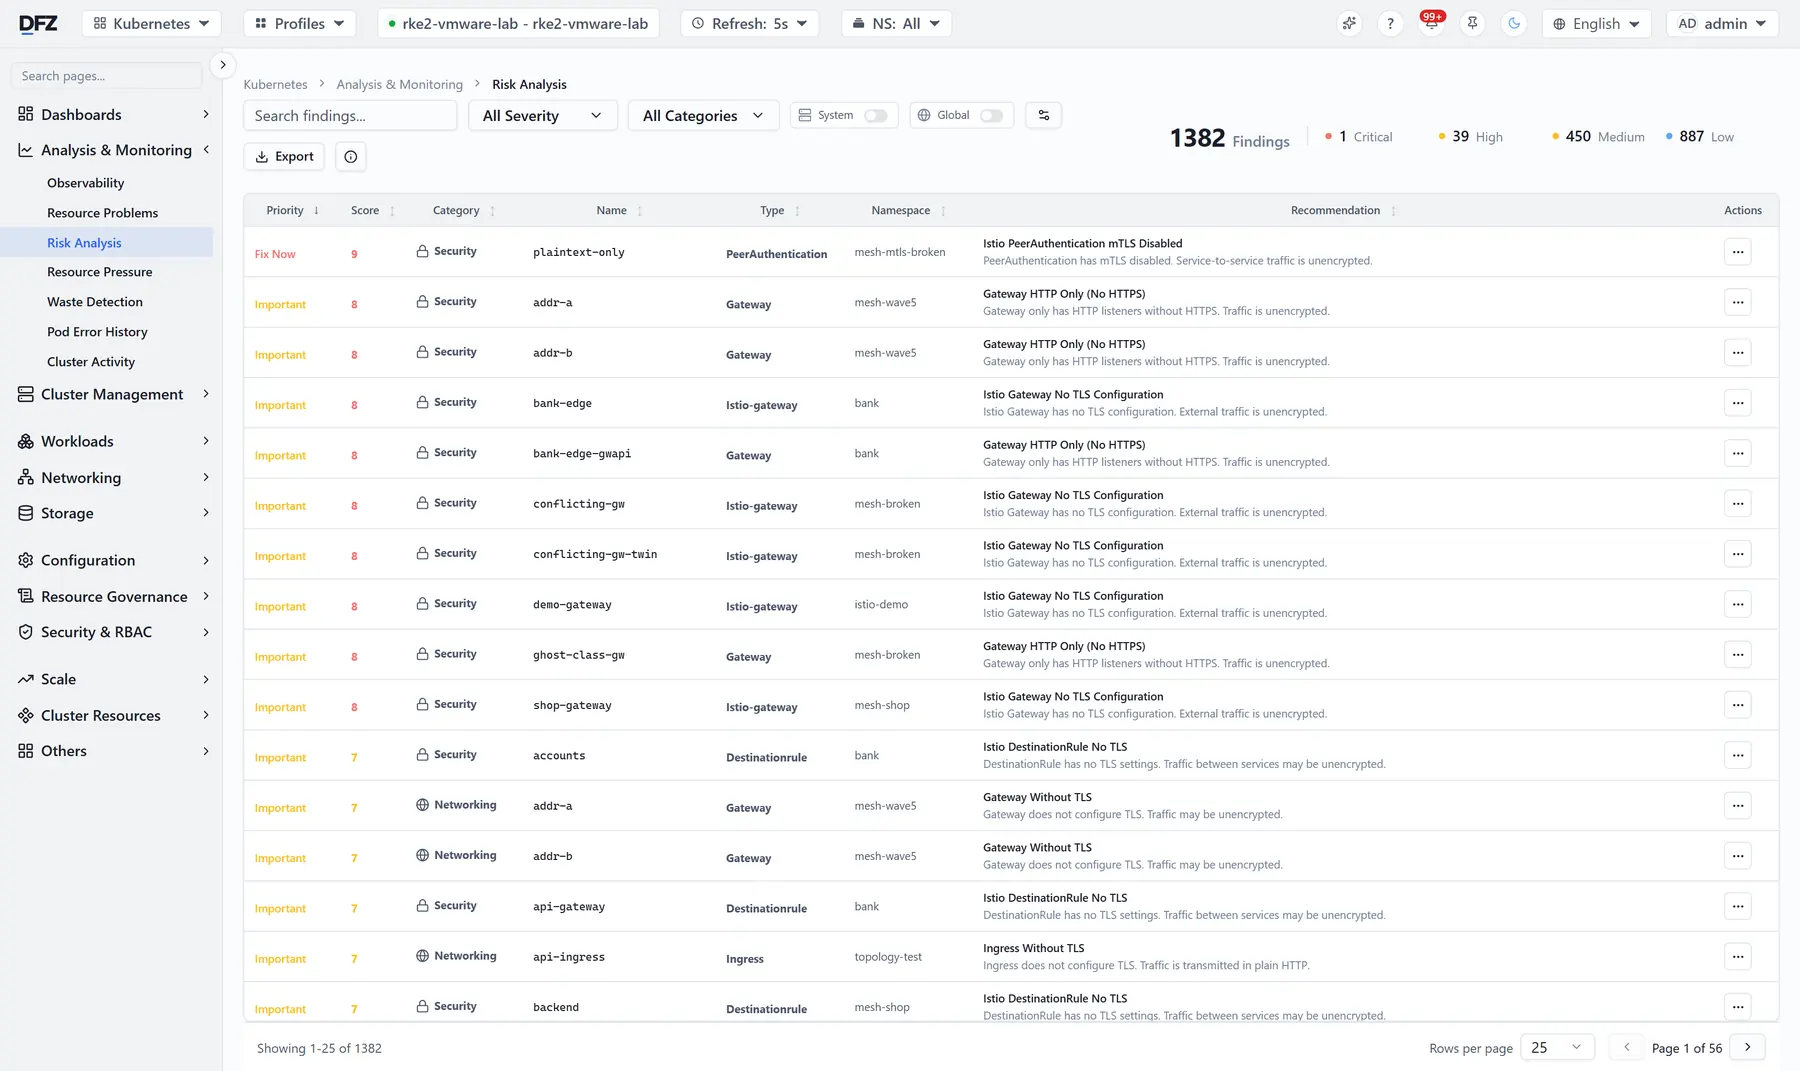
Every rule that fired, scored and sorted, with the namespace, the object and what to do about it.
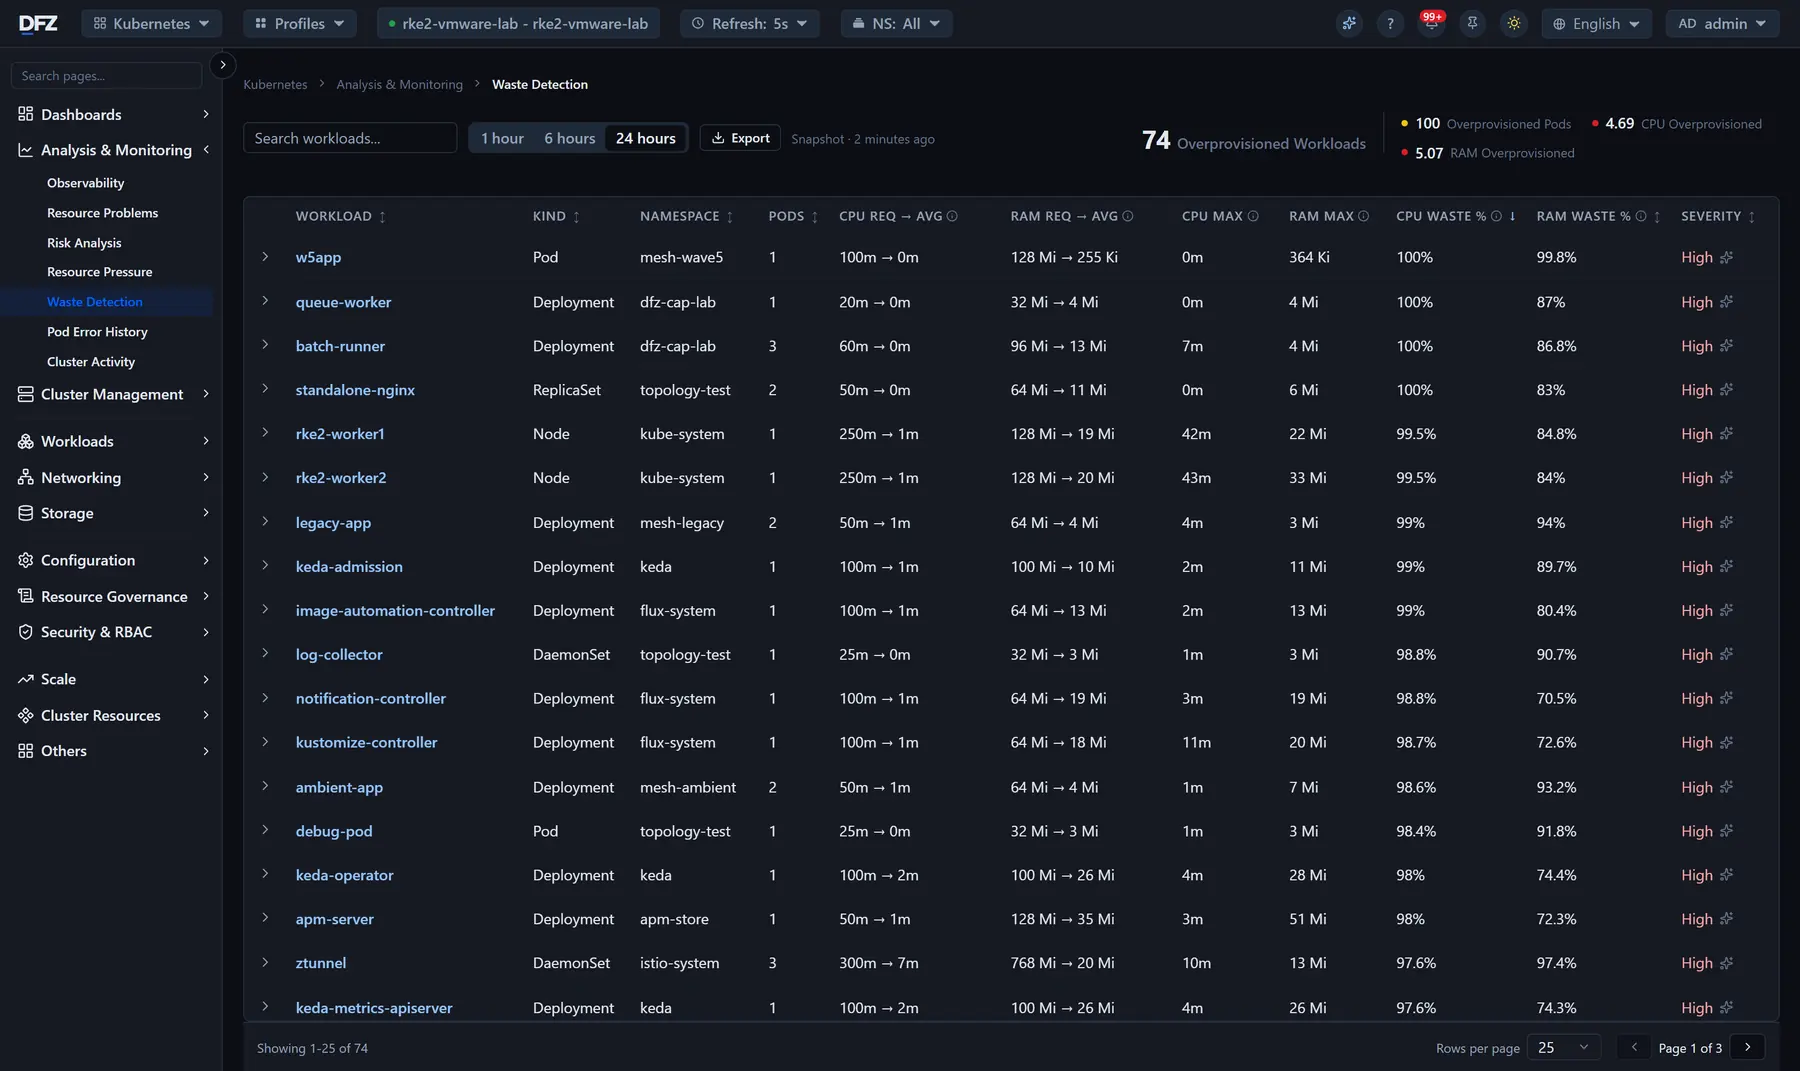
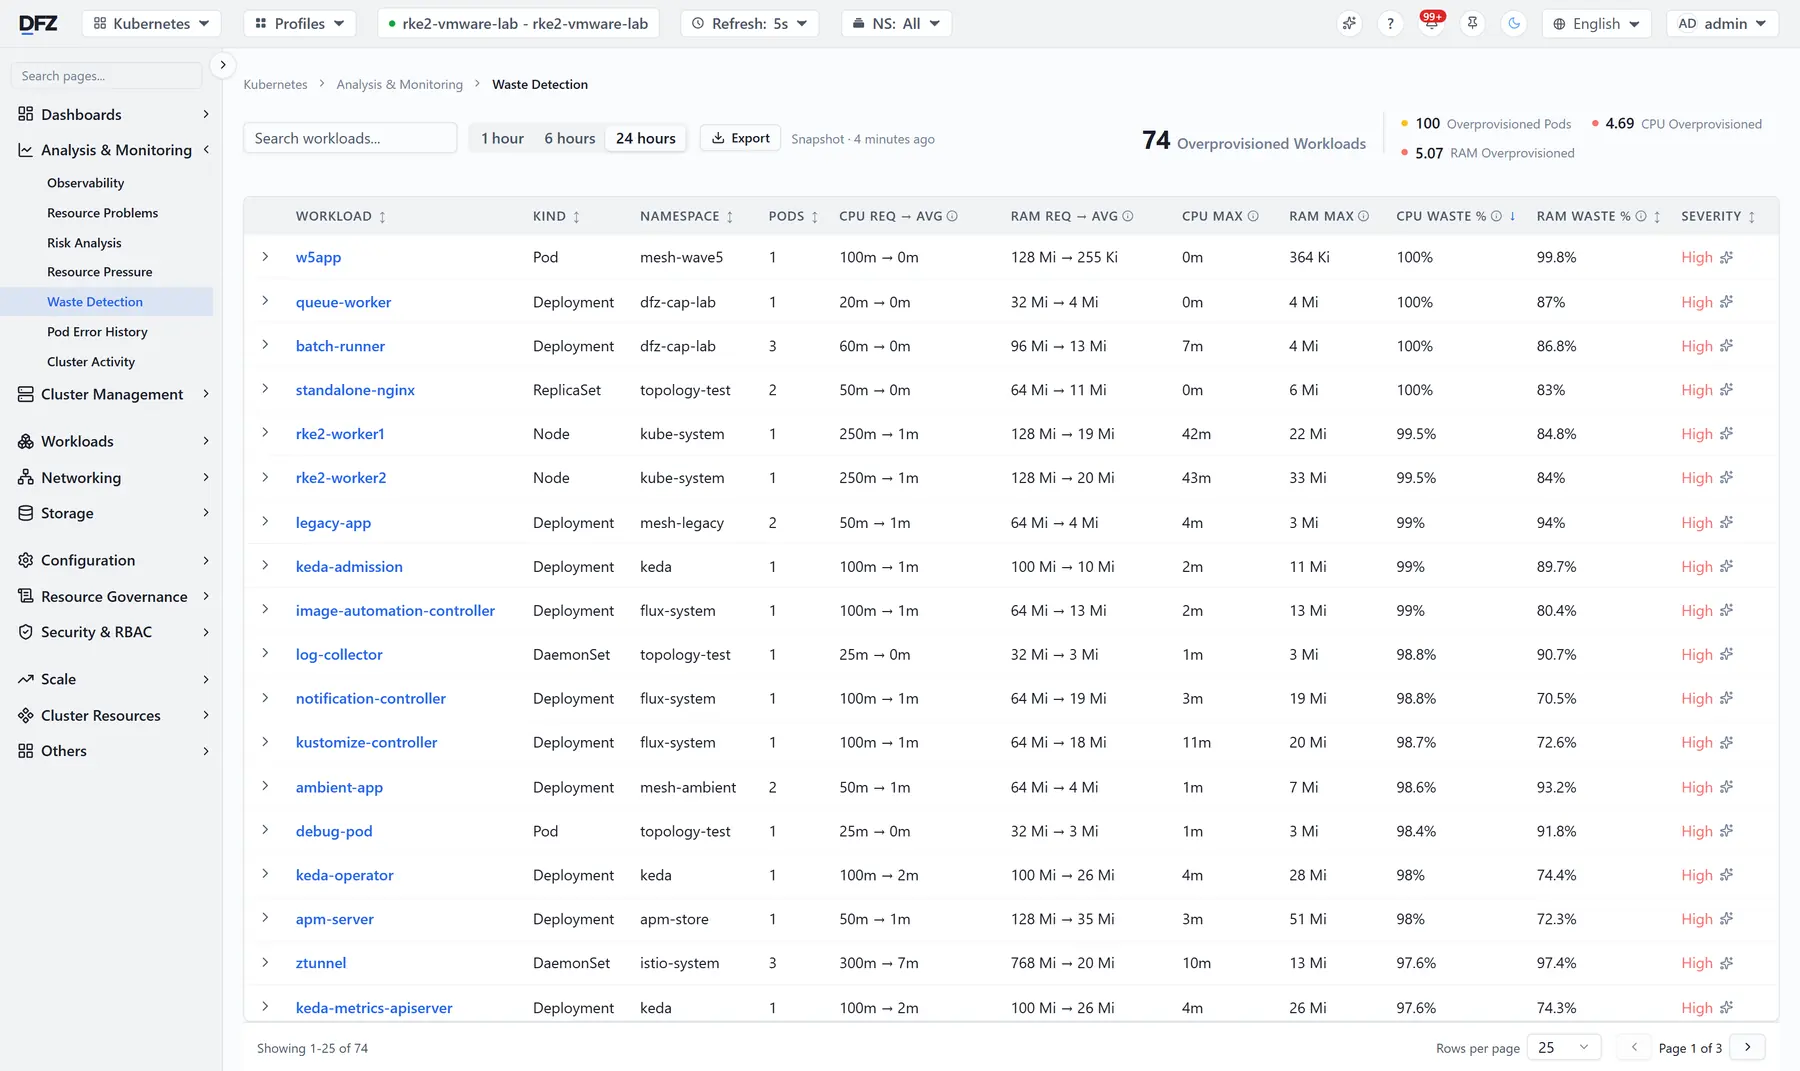
Requested CPU and memory against what is actually consumed, per workload — the list that has a line on your bill.
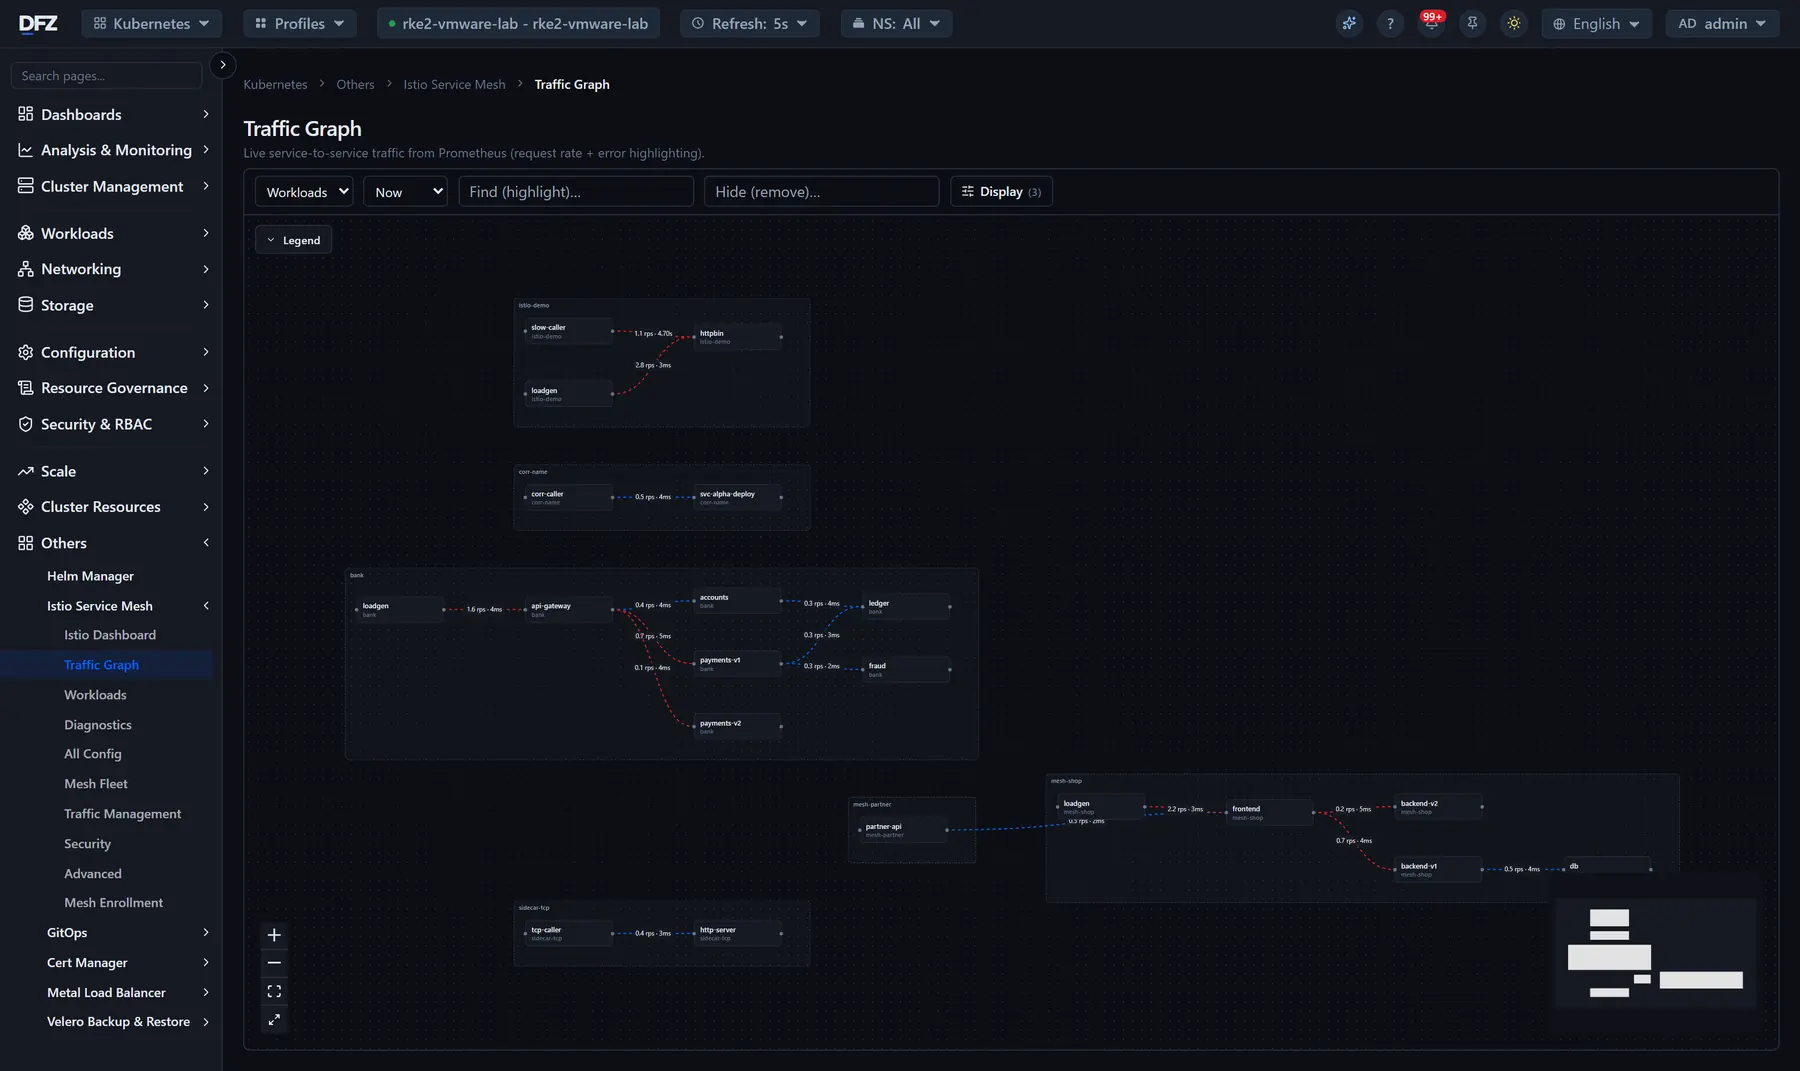
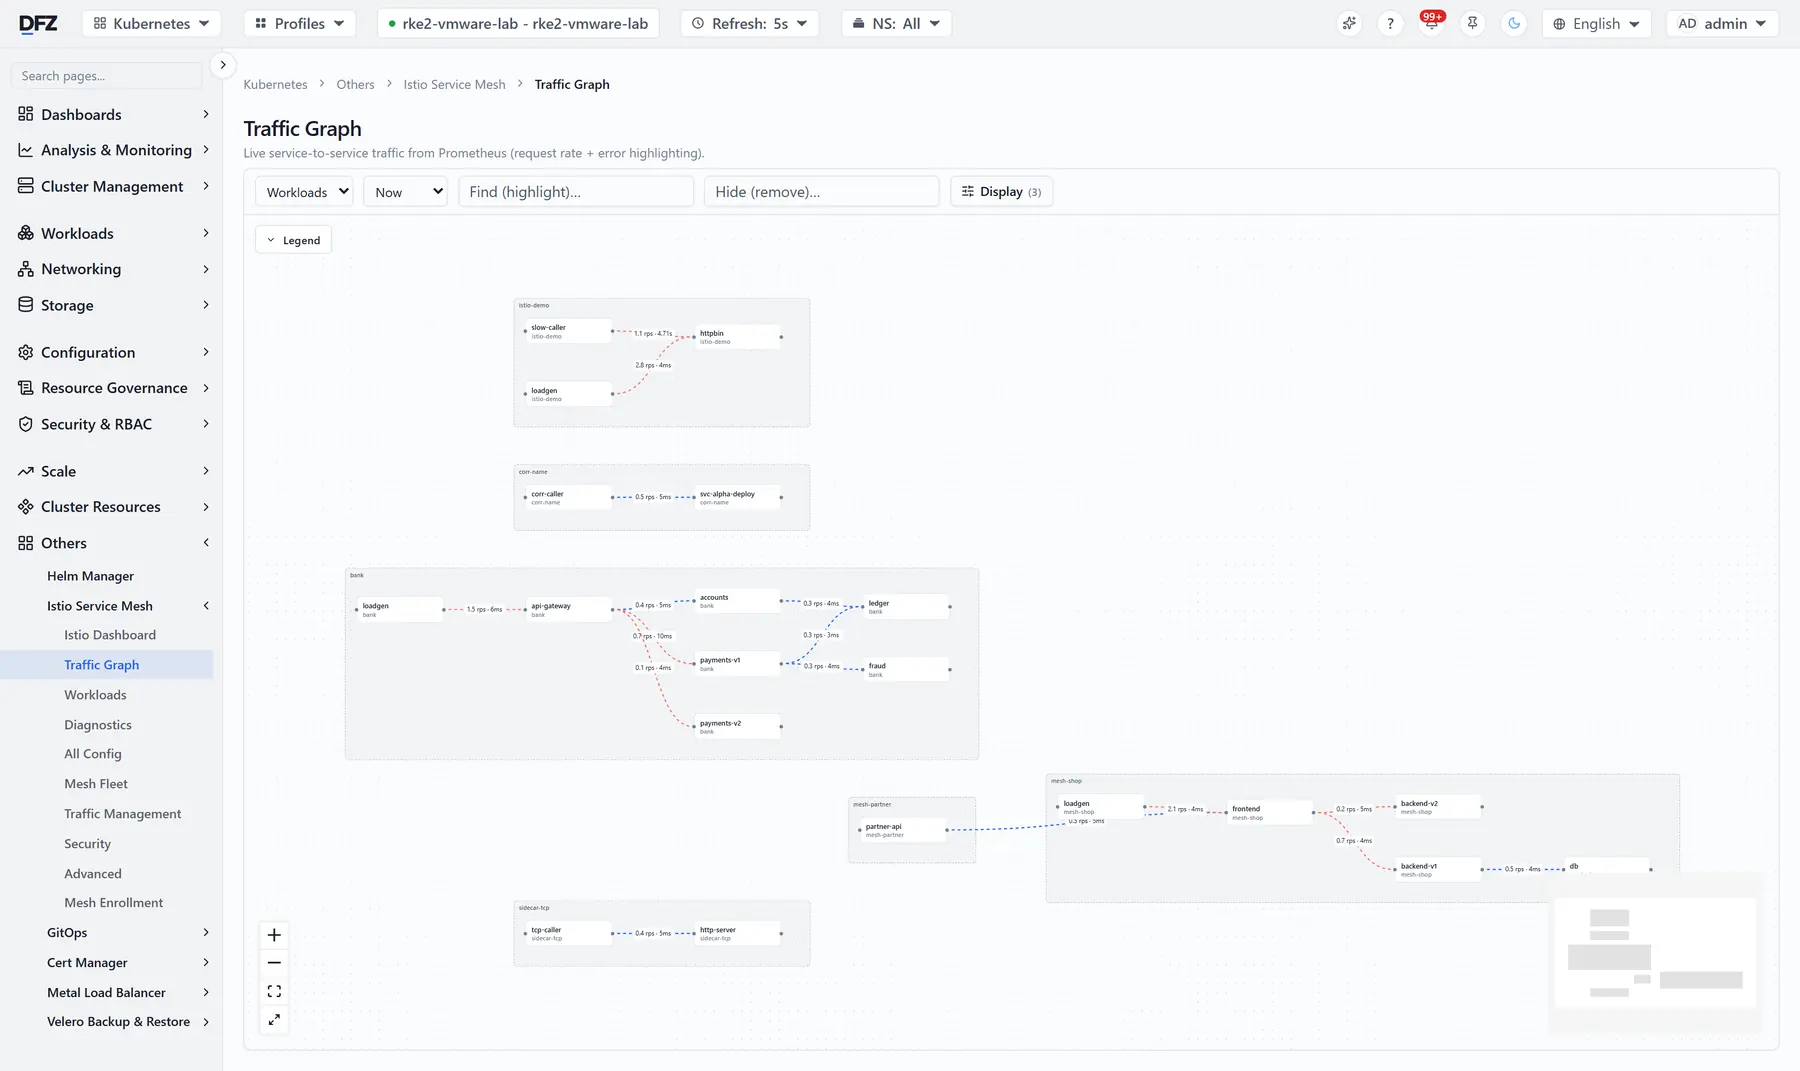
A live map of service-to-service calls with request rate and latency on every edge; failing paths are drawn in red.
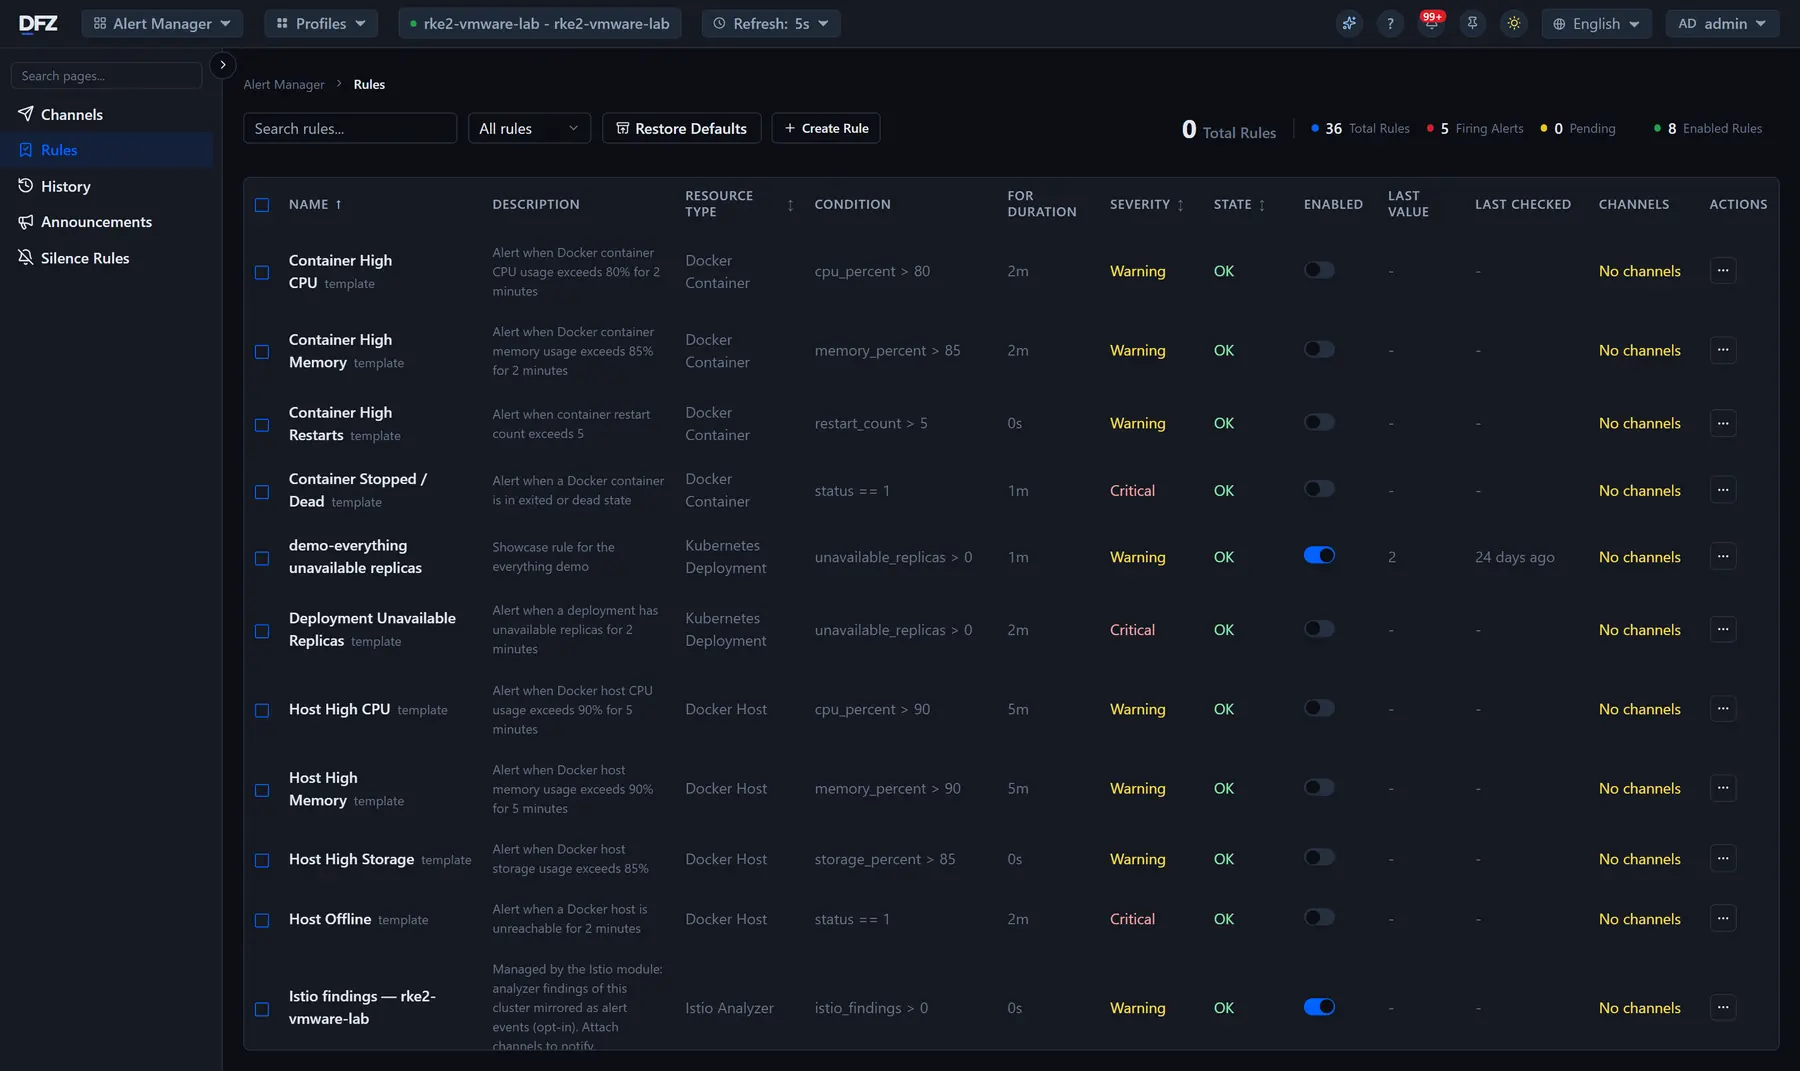
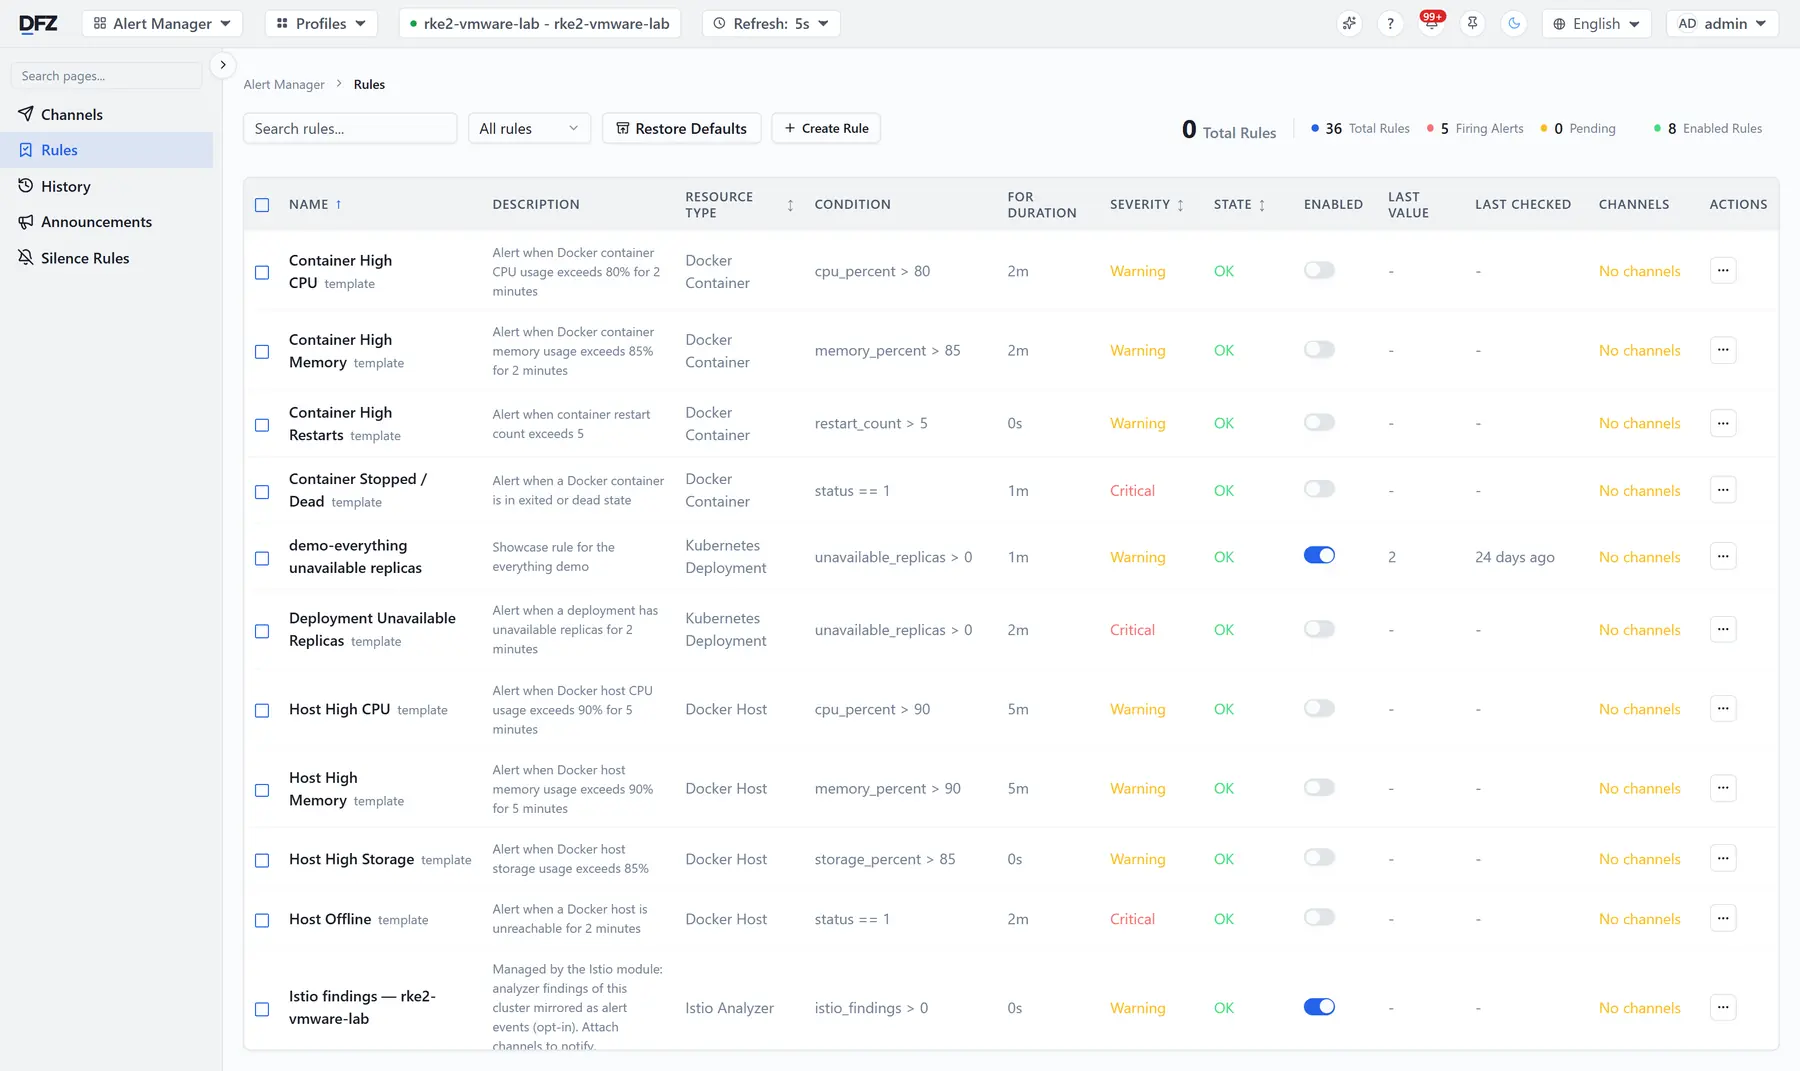
Pick a resource type, a metric, a threshold and a severity, then choose the channels. Ready-made rules ship switched off.
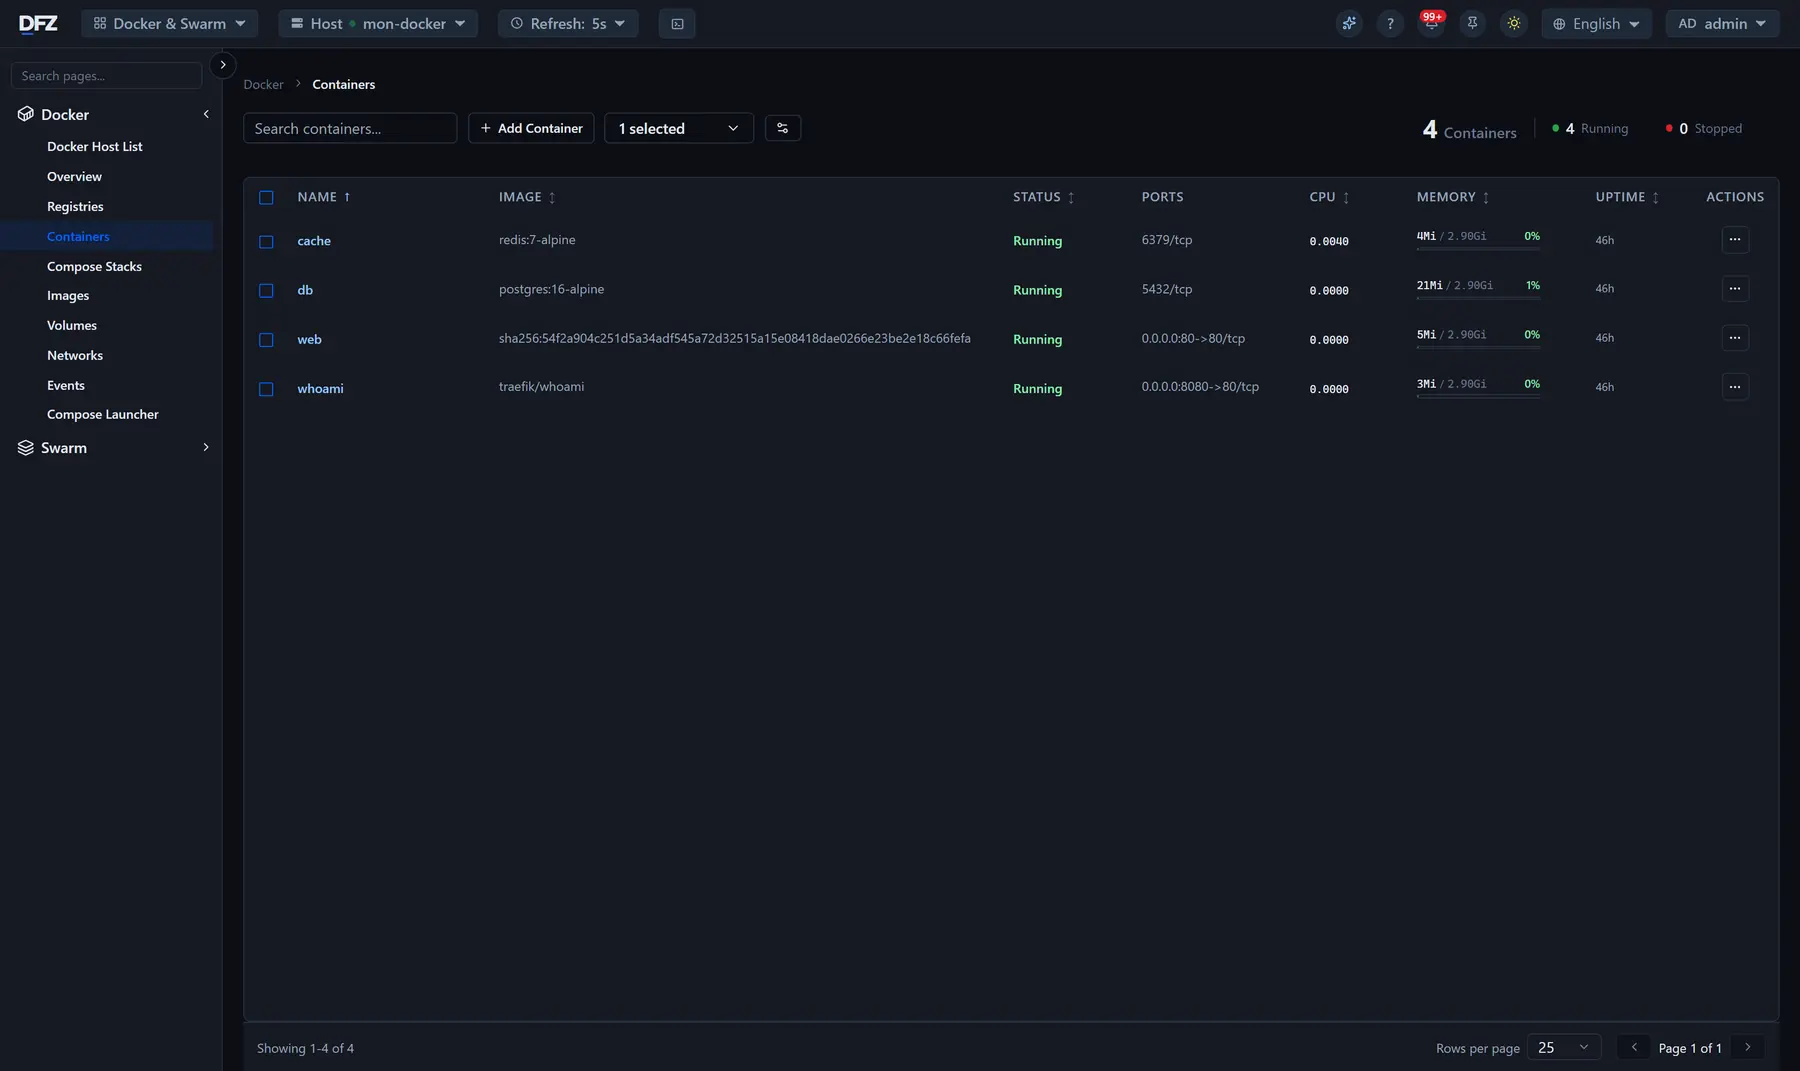
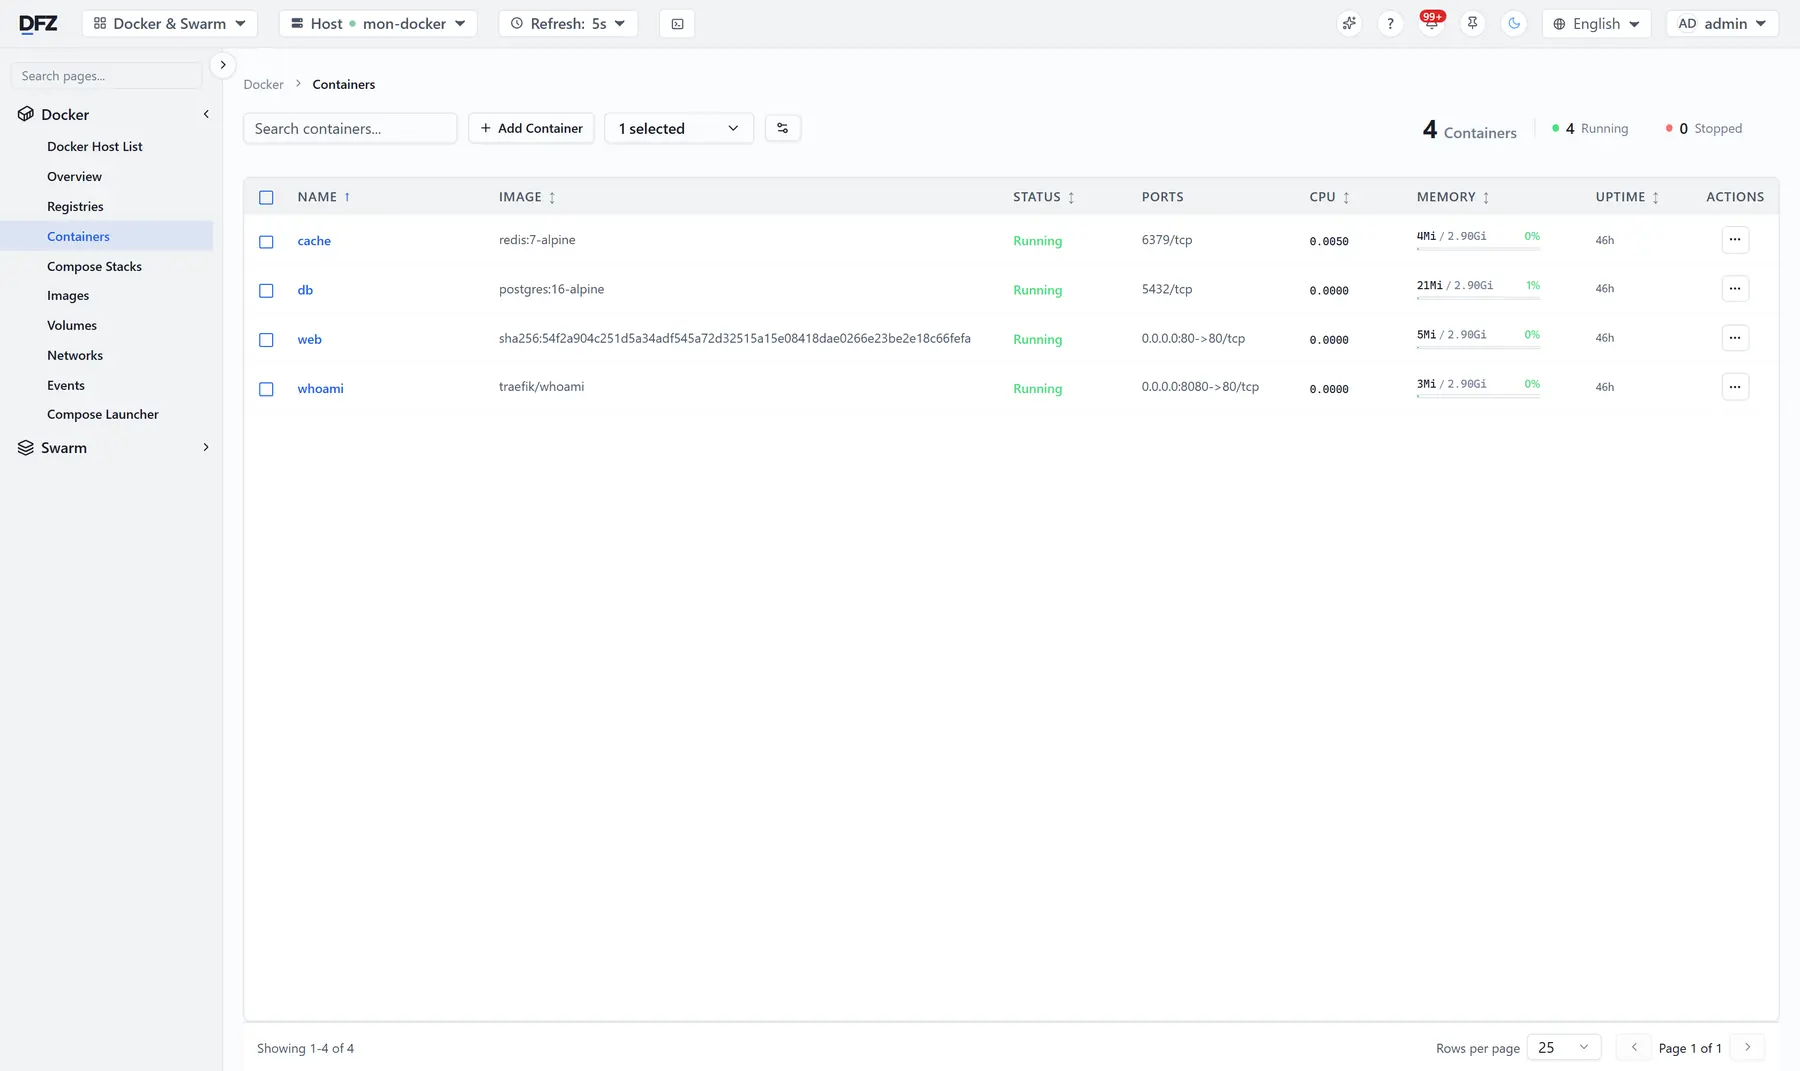
Container state, image, ports, CPU and memory, uptime — and a terminal into the container without leaving the page.
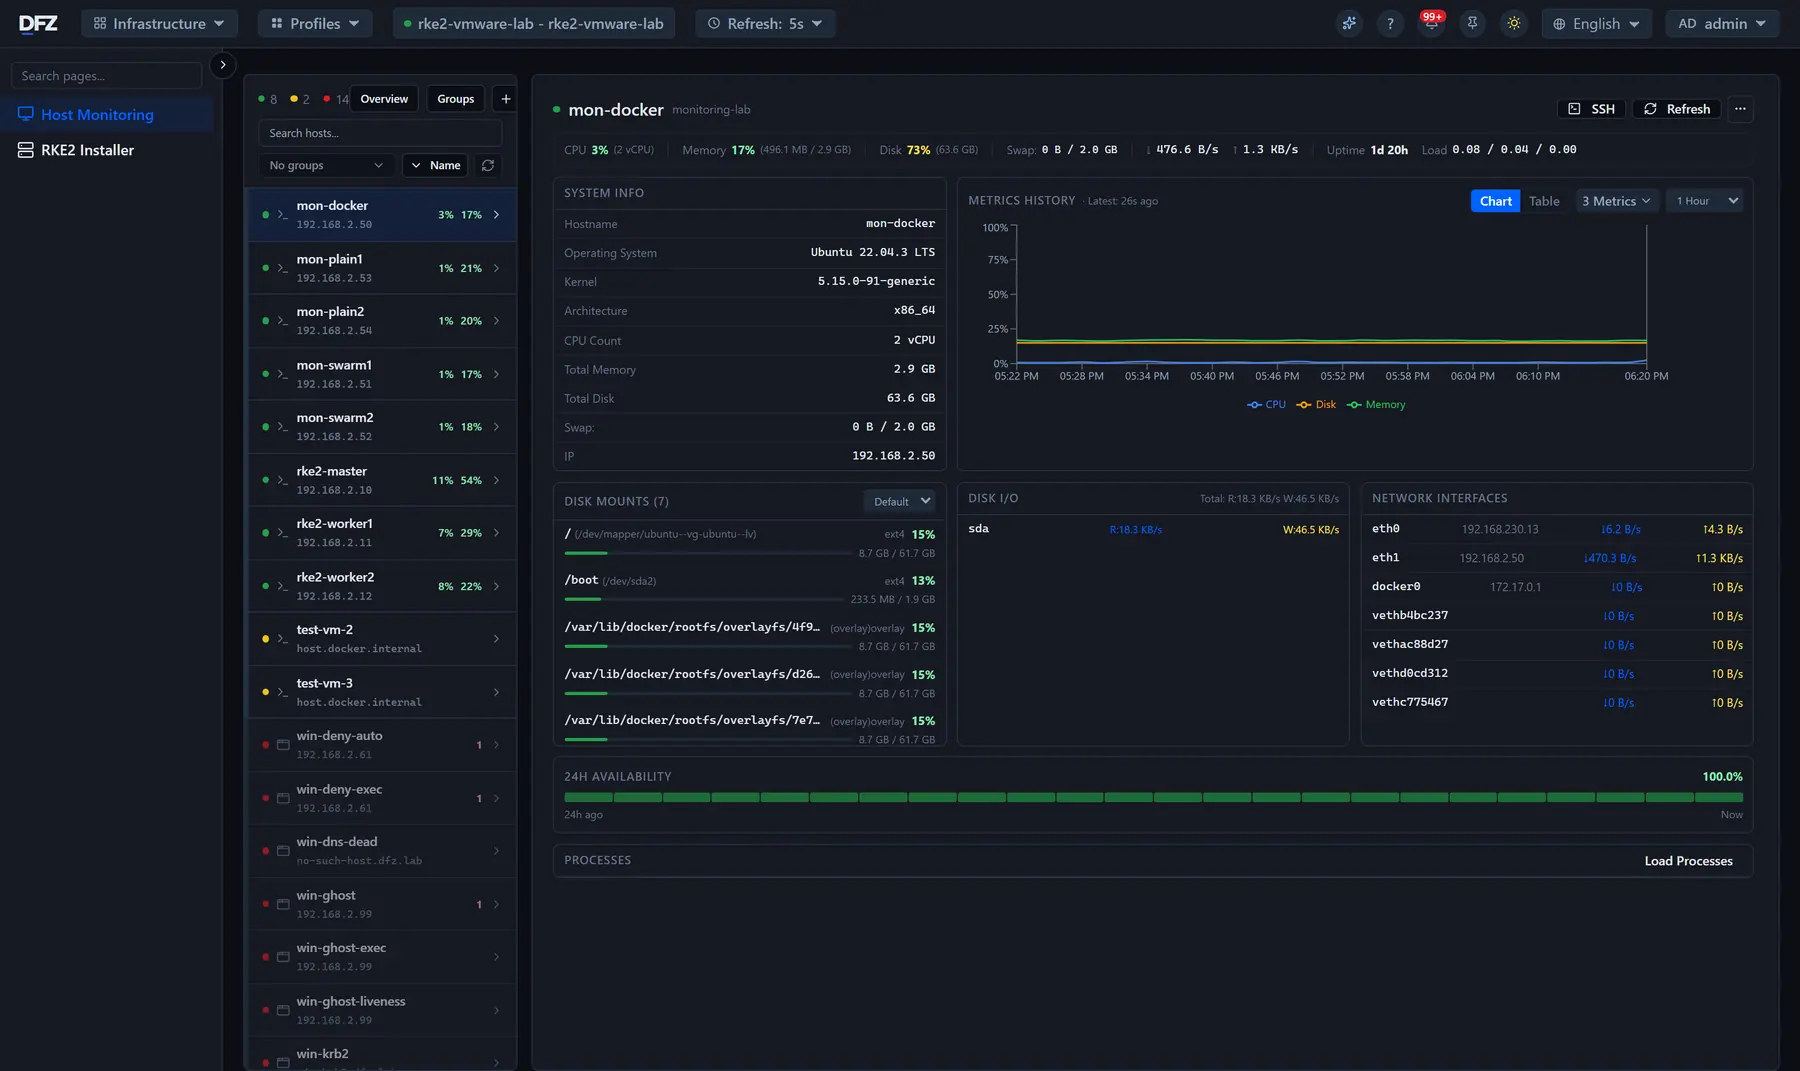
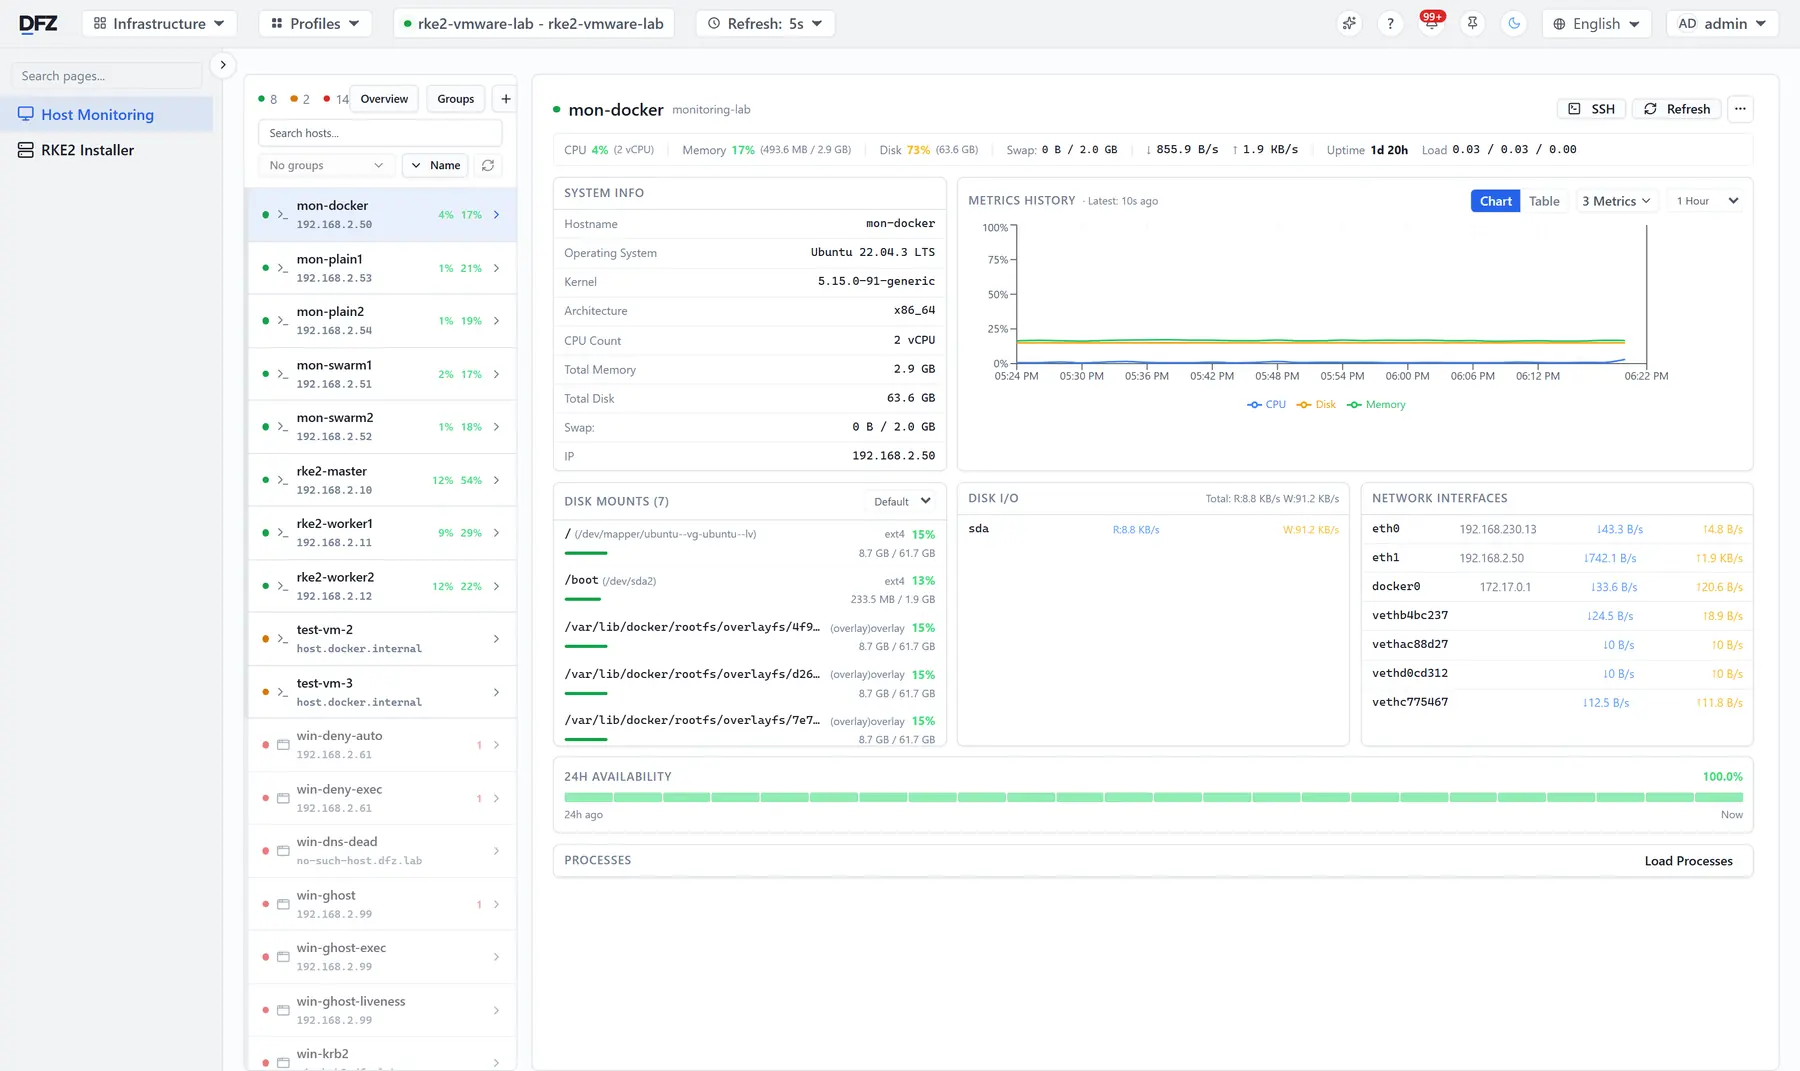
Which server is up, which one stopped answering, which one is under pressure — Windows, Linux and macOS, agentless.
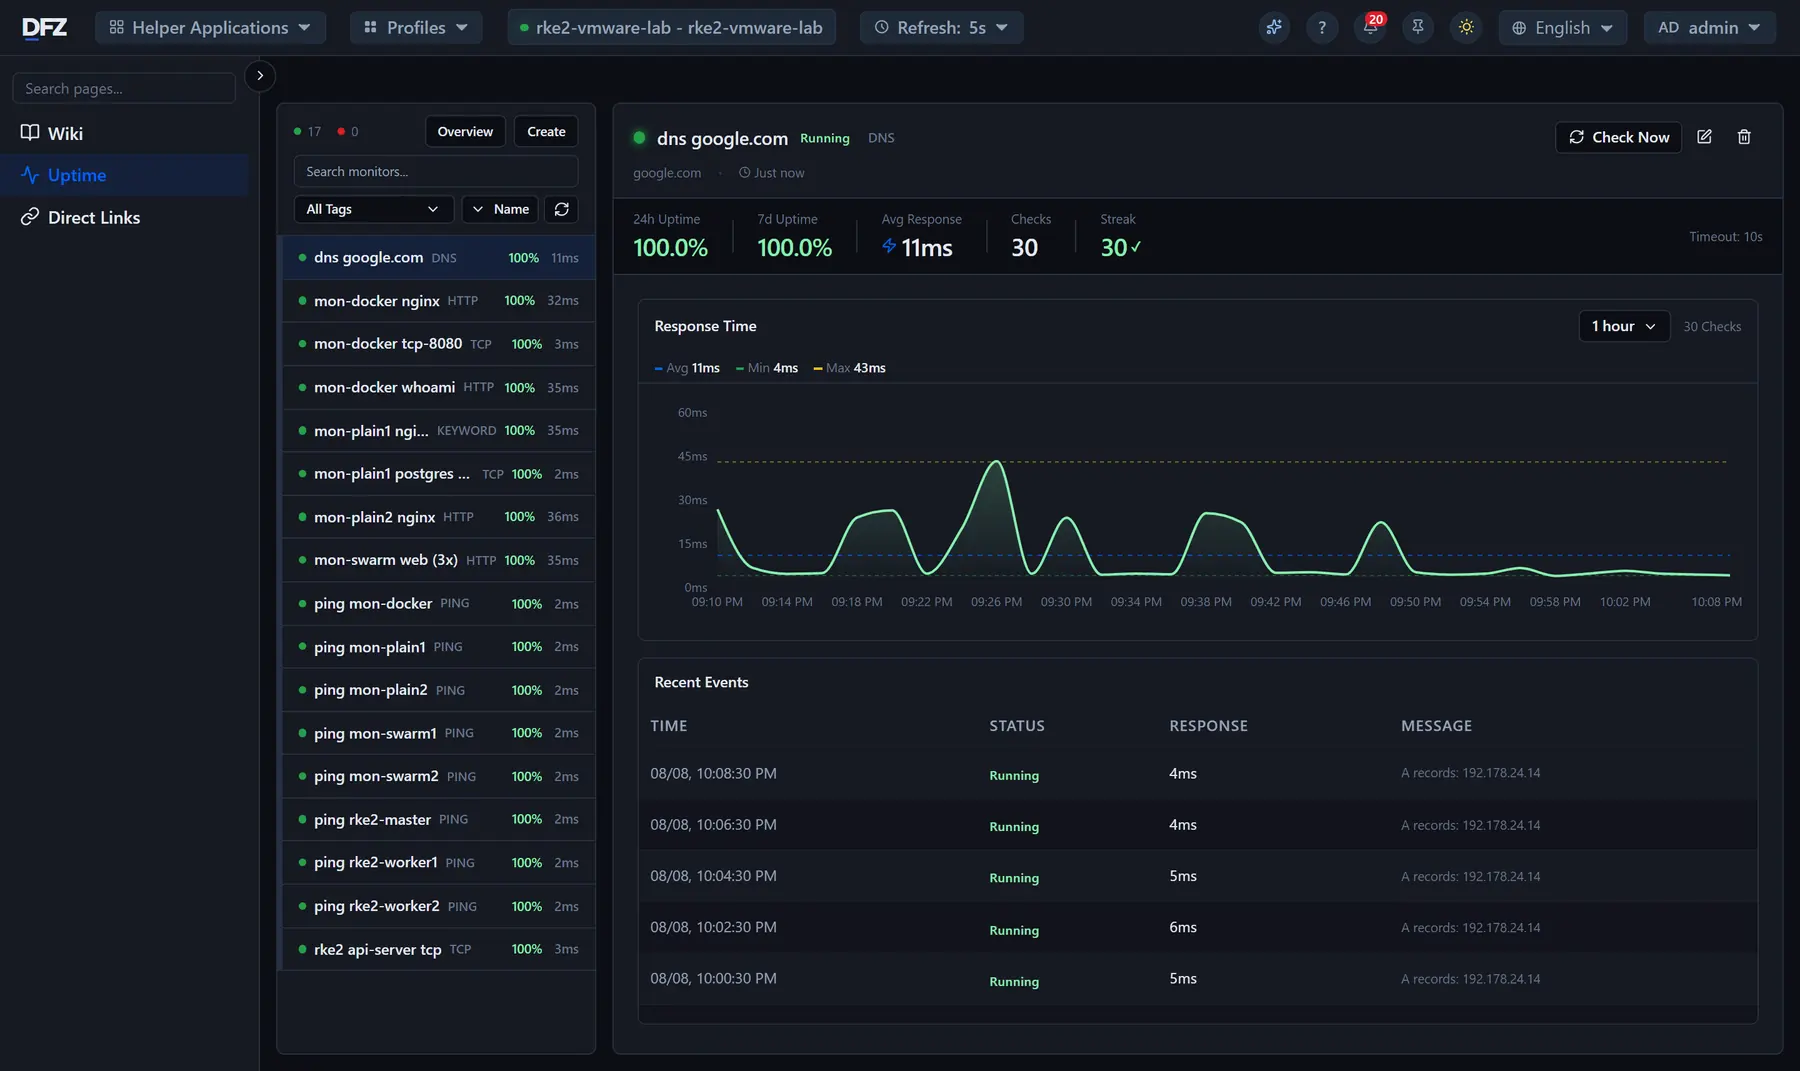
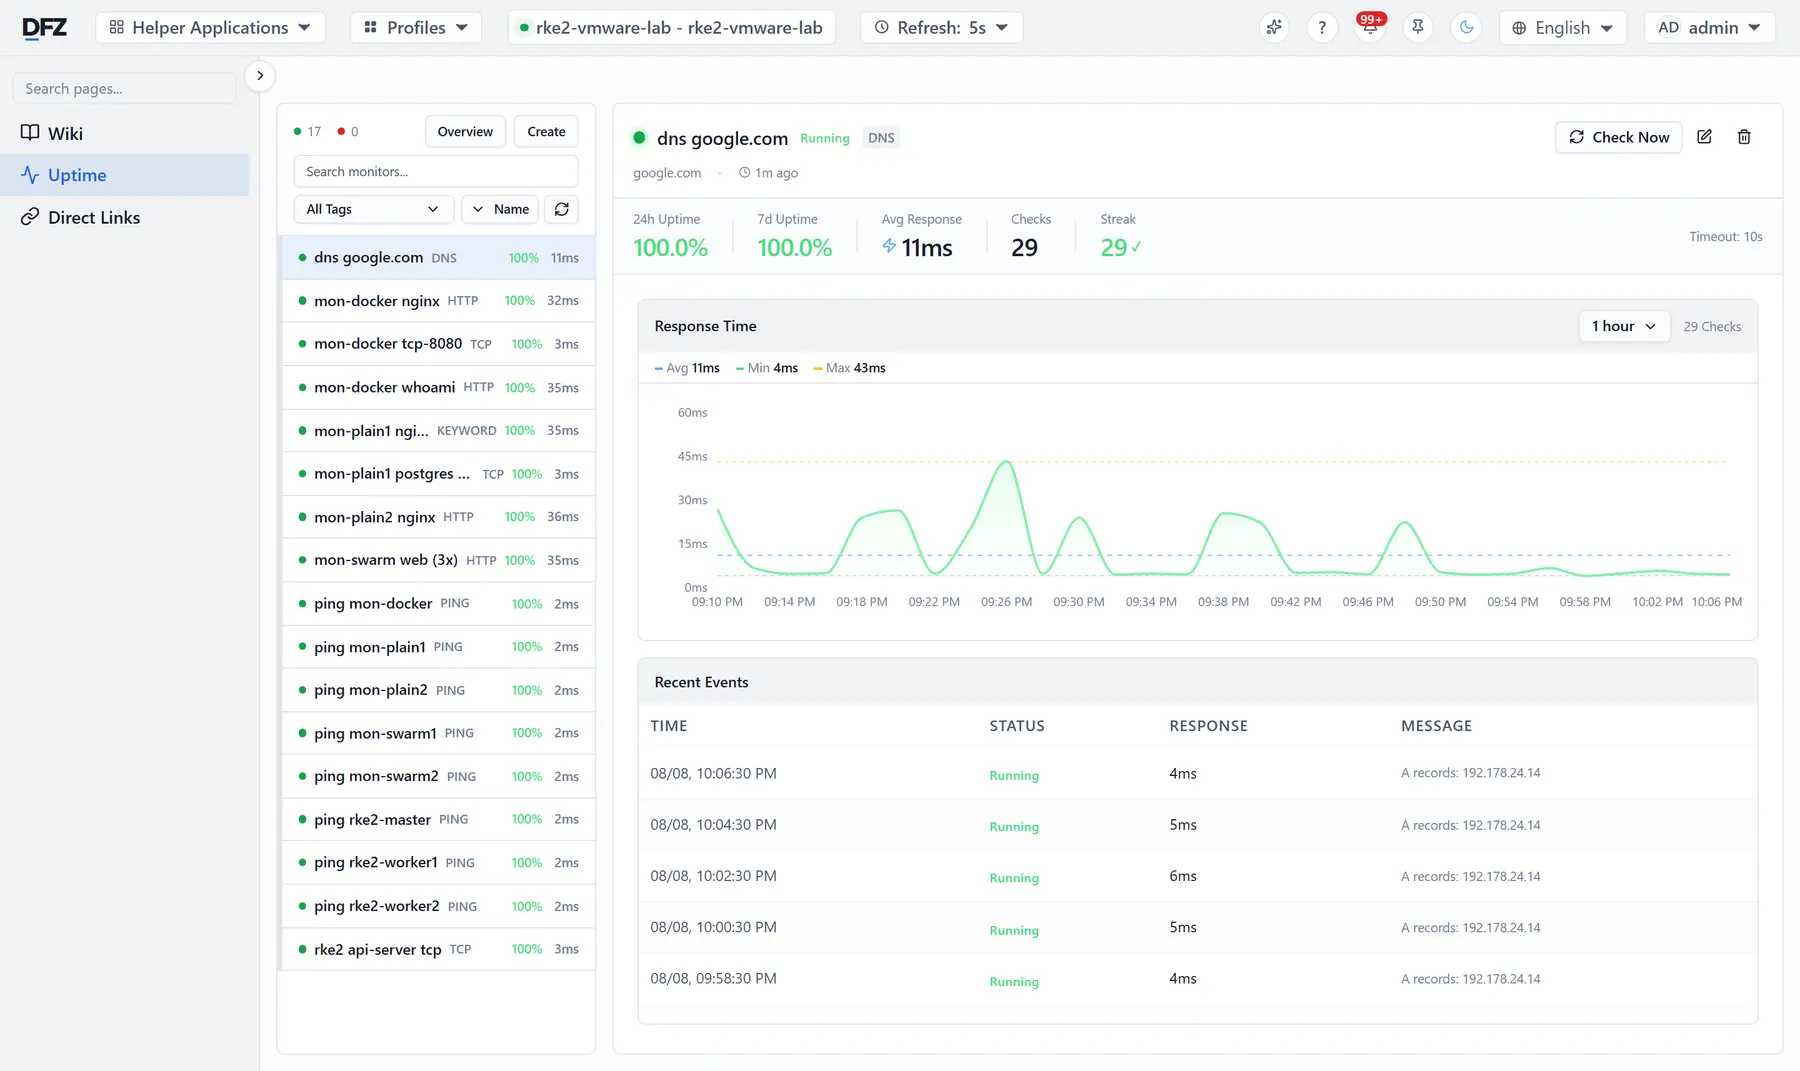
HTTP, TCP, ping, DNS and keyword checks, with response-time history and a record of every check. A failing check enters the same alert lifecycle.
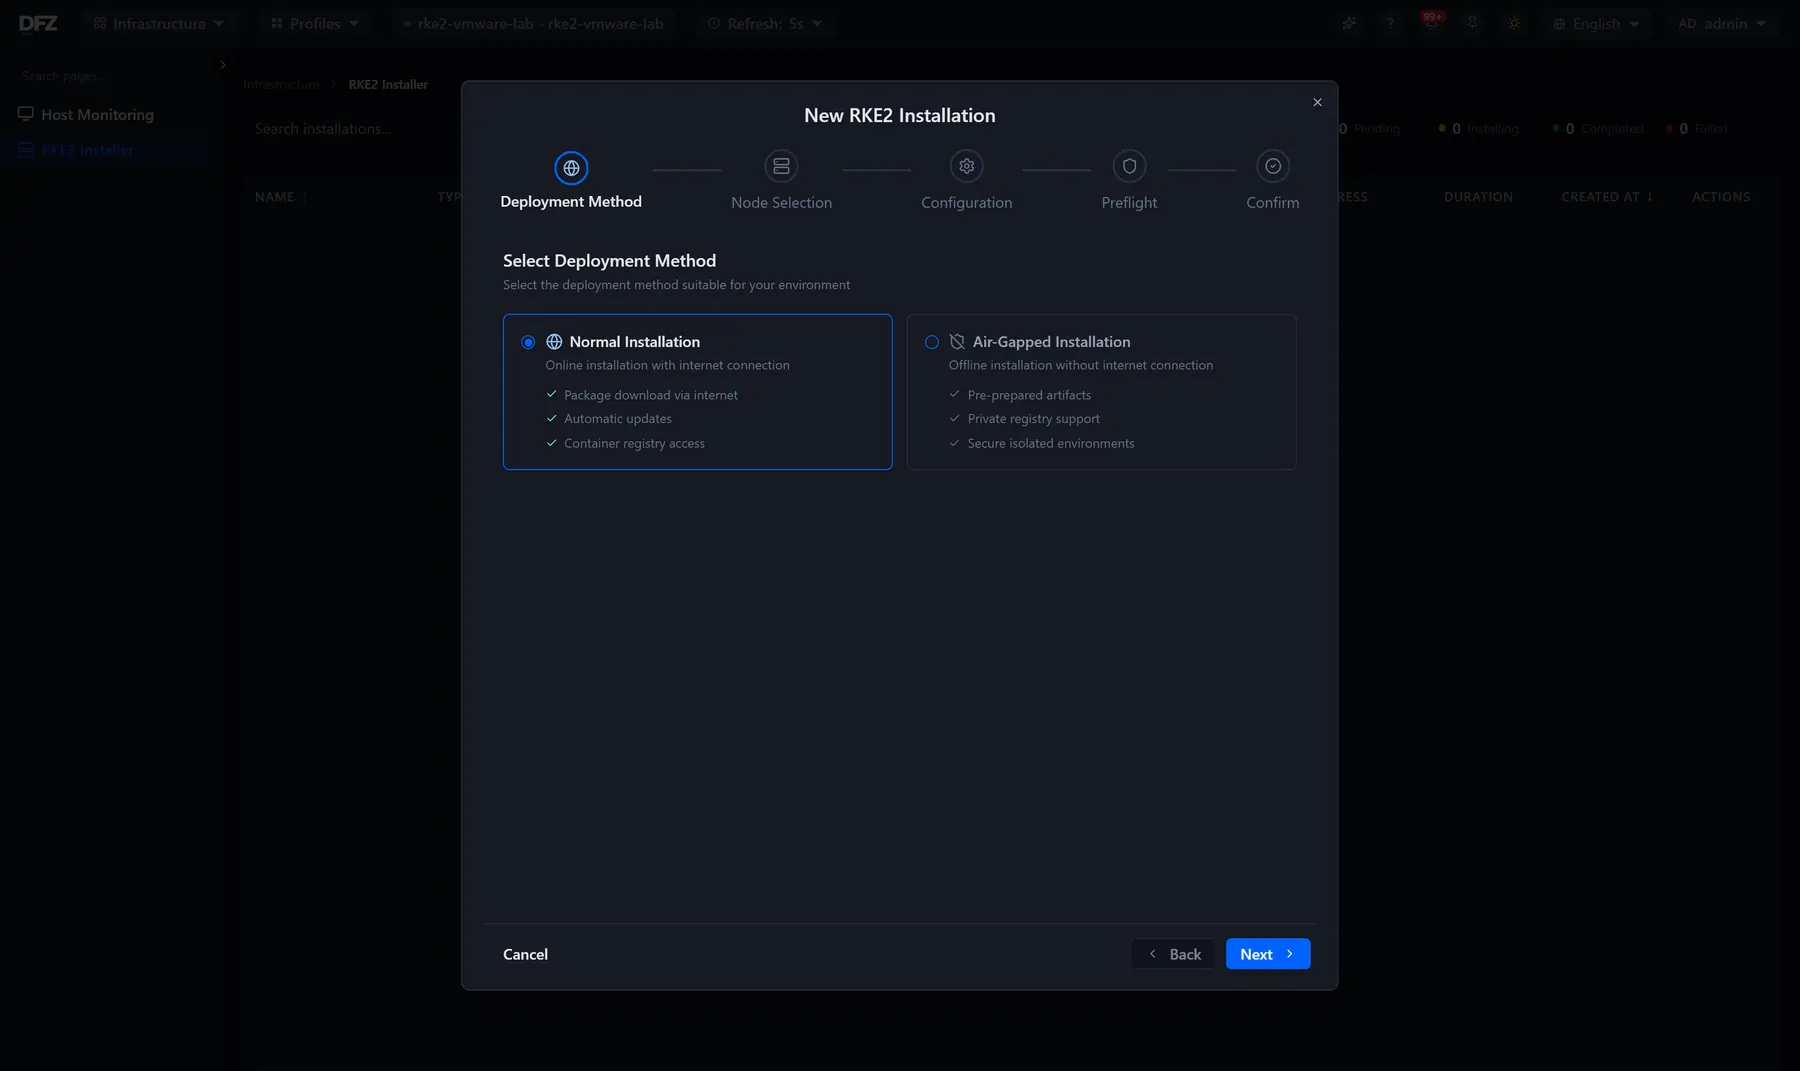
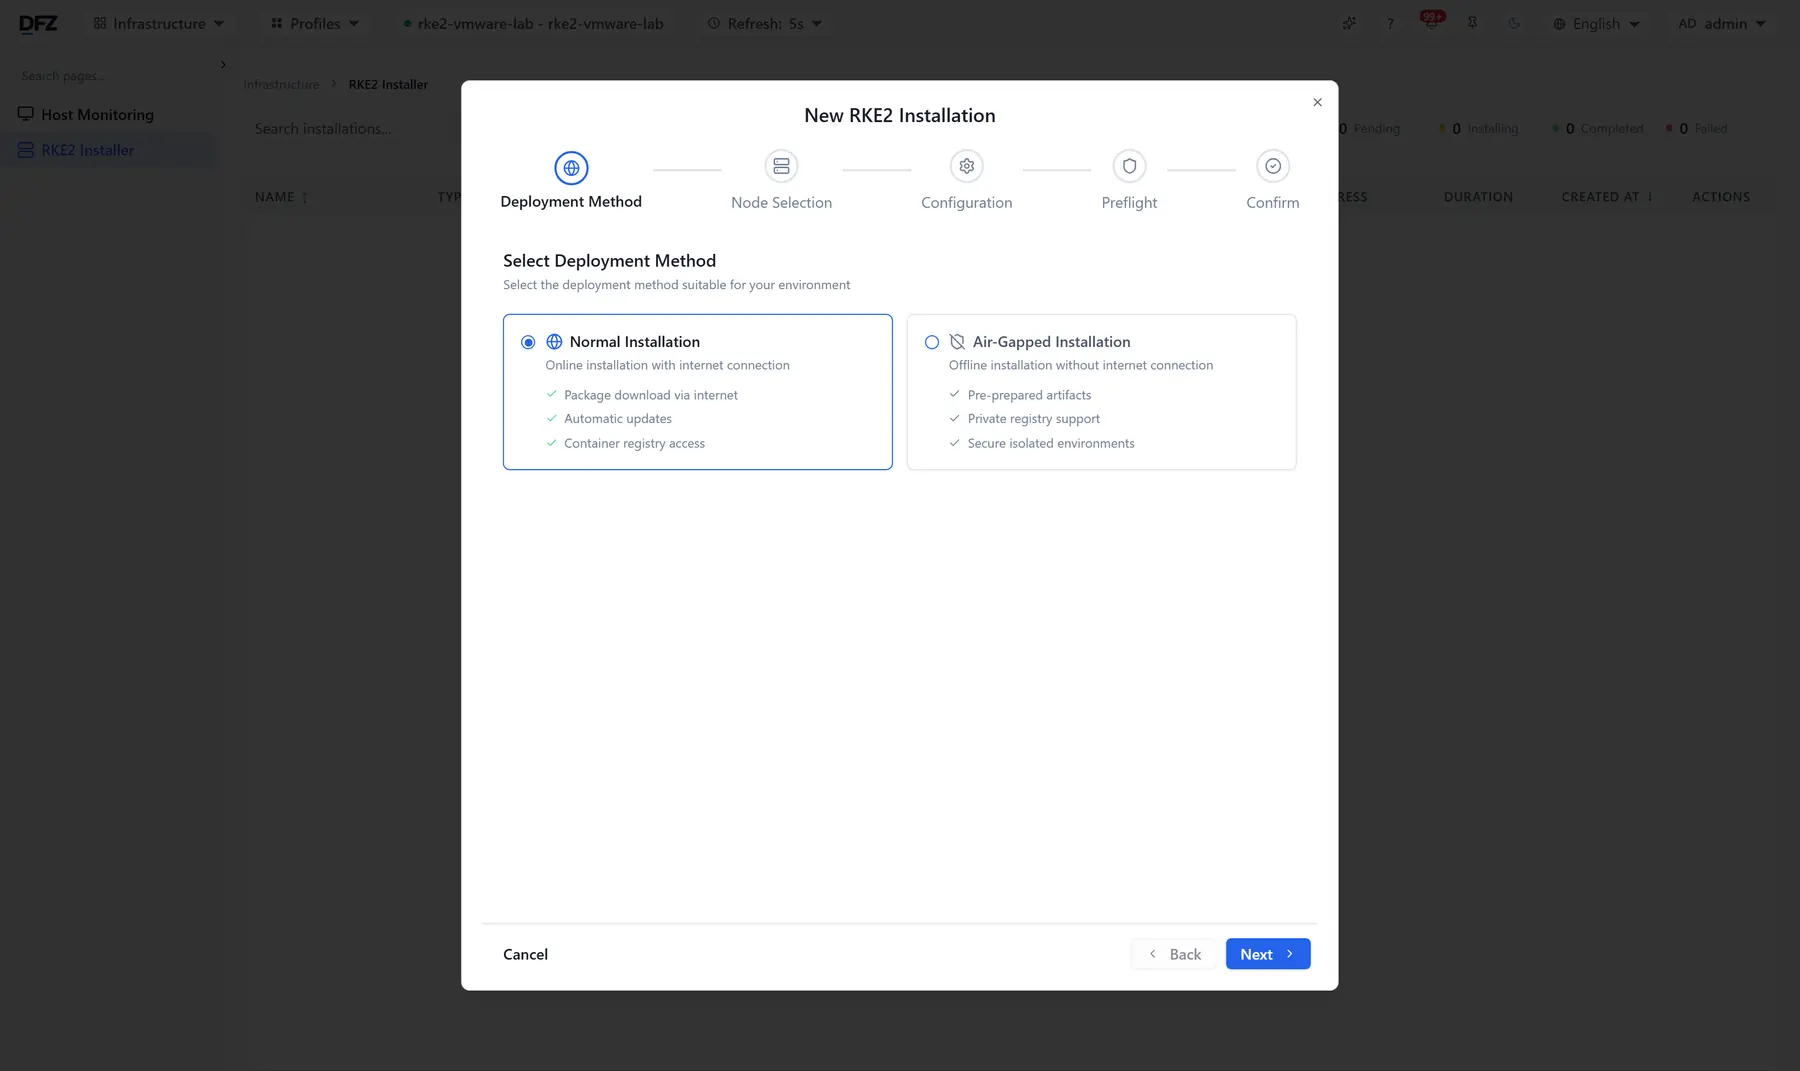
Distribution method, node selection, configuration, preflight and confirm. Air-gapped installs run from prepared artifacts and your own registry, with no internet at any step.
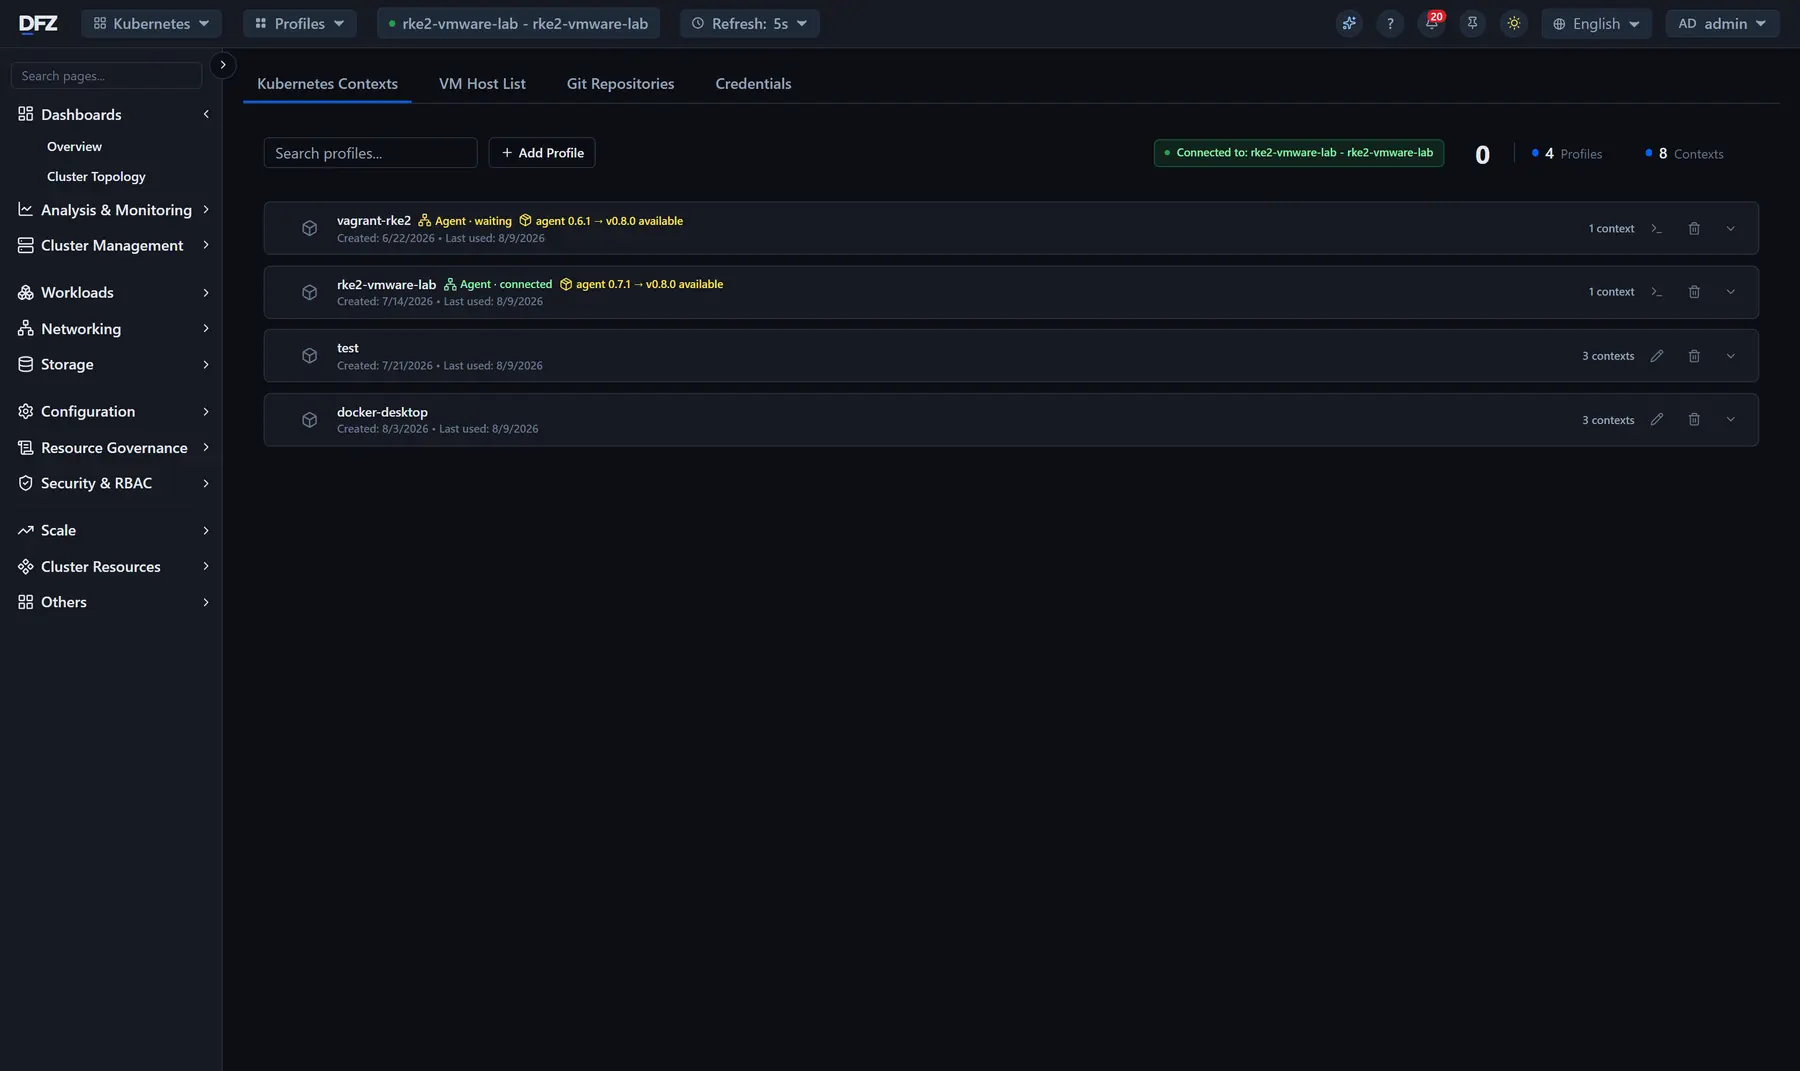
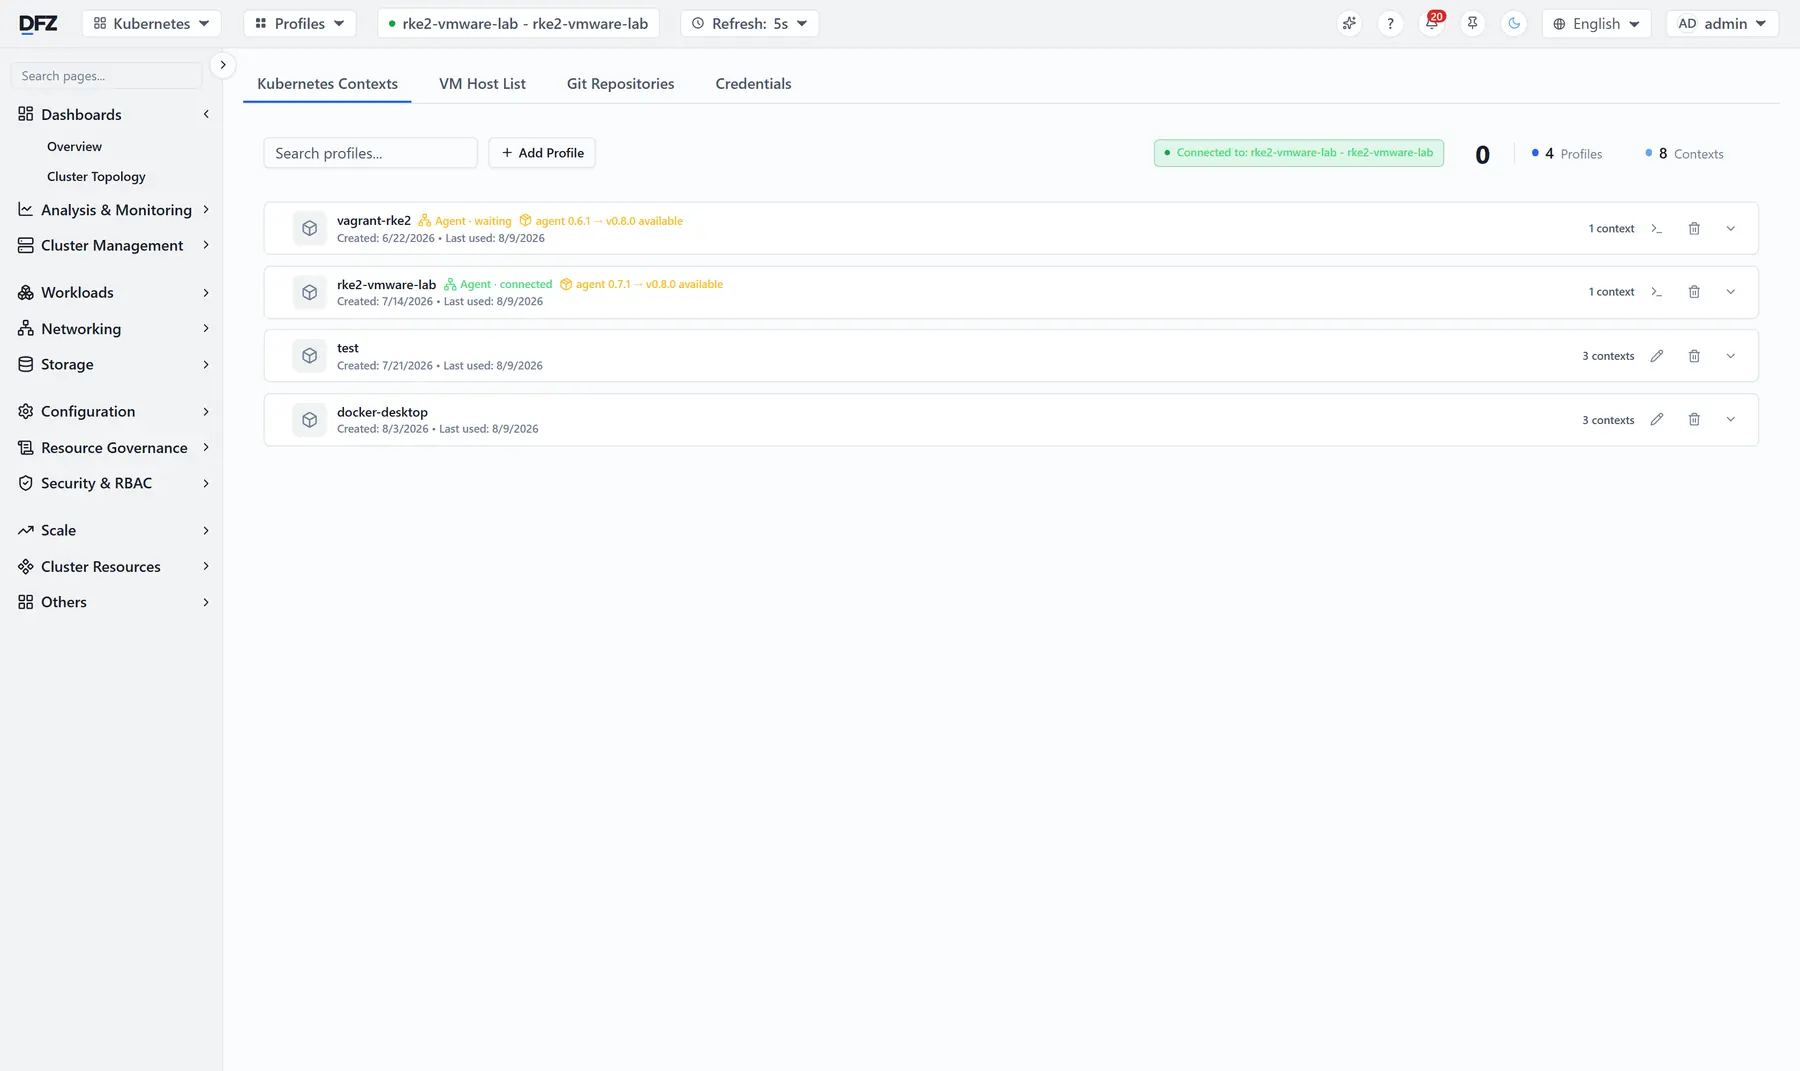
Kubernetes contexts, servers, Git repositories and credentials in one place. Each profile carries its agent state and version, so you can see what is reachable before you need it.
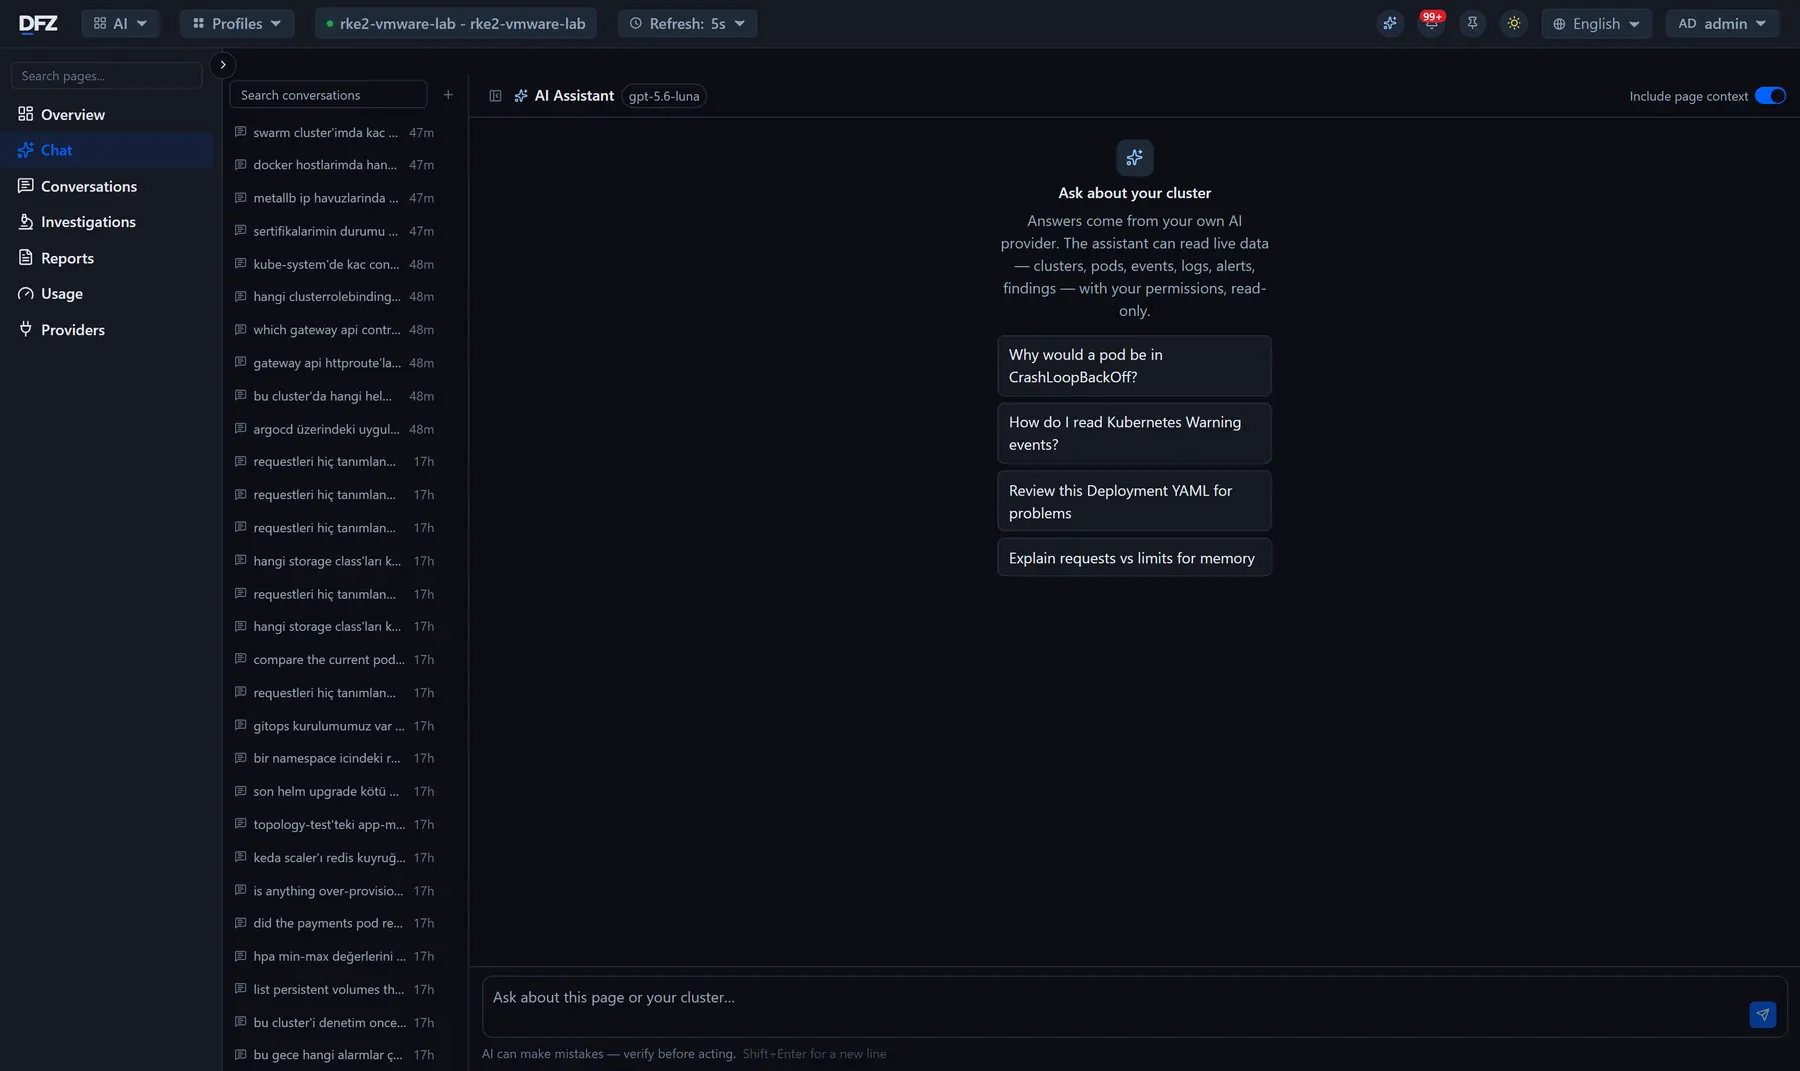
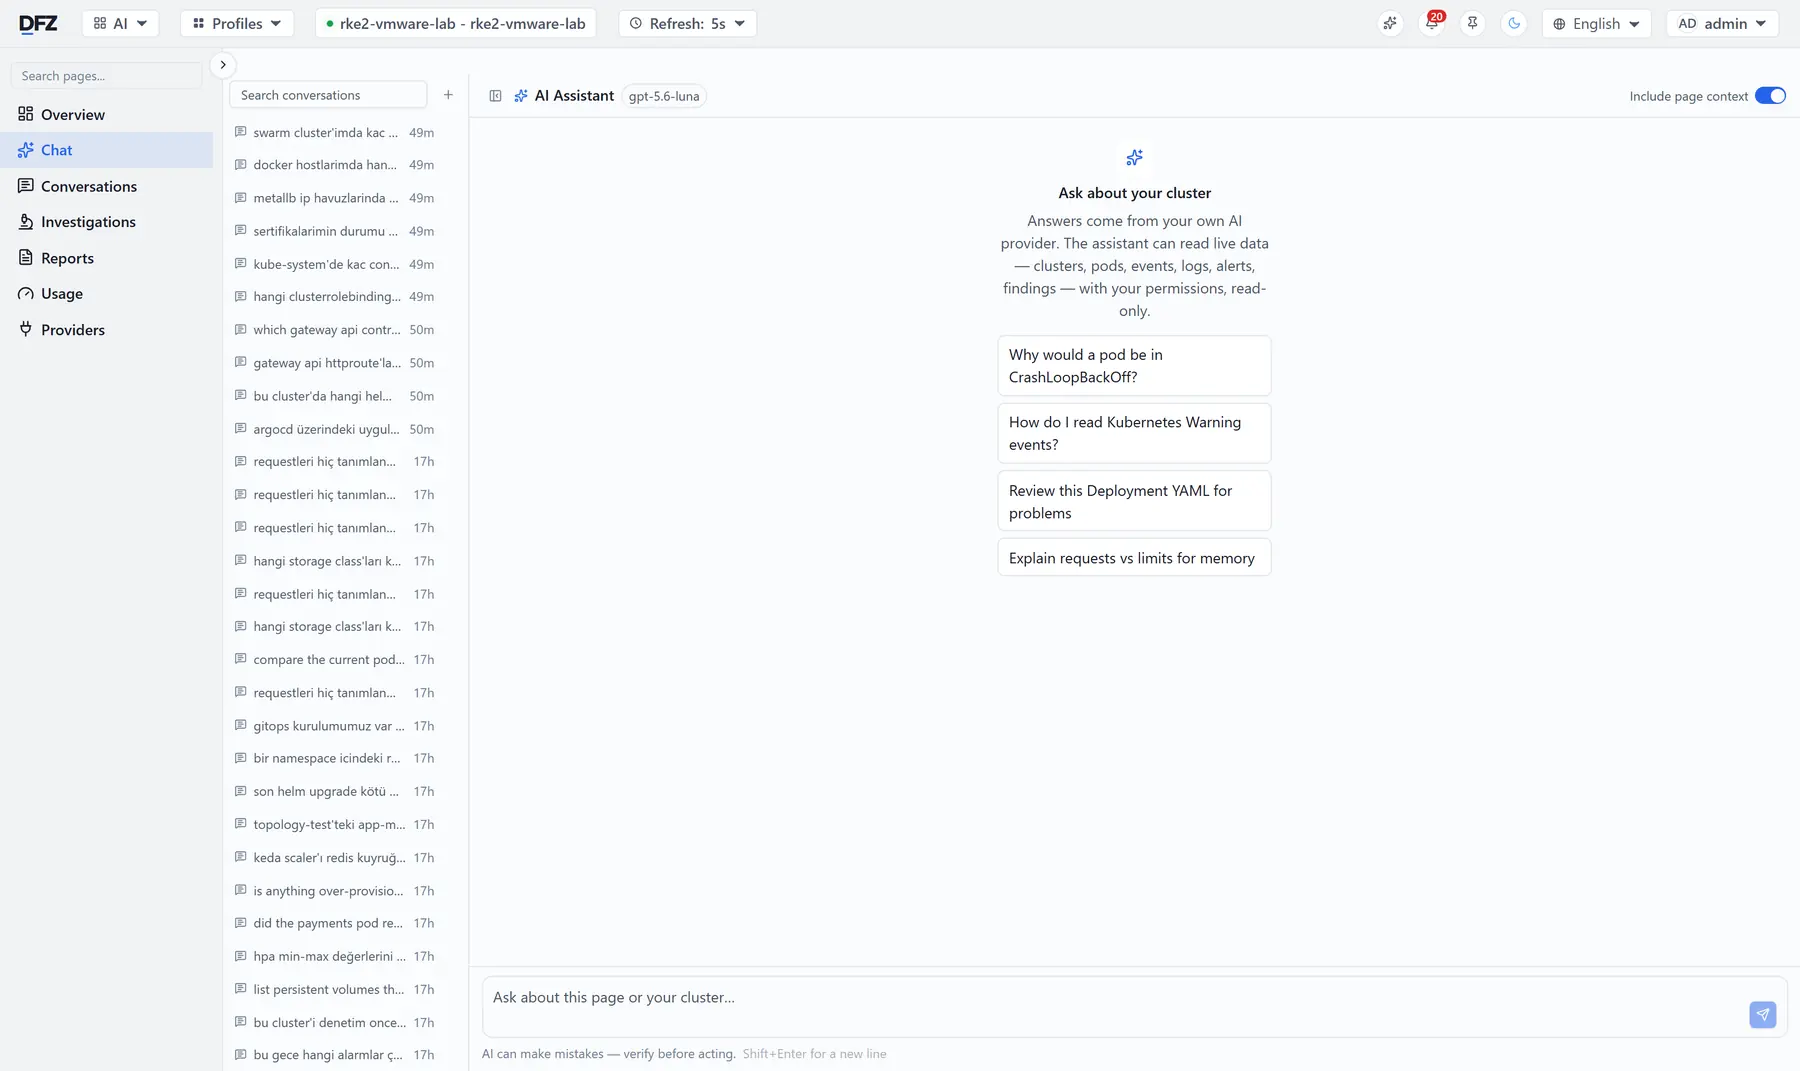
The assistant answers from the live data of the page you are on, using the AI provider and key you configured.
Not a Kubernetes admin panel — an operations console for mixed infrastructure.
Stream logs from every pod under a workload in a single terminal. Per-pod colour coding, search across pods, container selection, pause and resume, live stream statistics.
Build rules for Kubernetes, Docker, servers and uptime checks with a form — no query language. Route them to email, Slack, Microsoft Teams, Discord, Telegram, a generic webhook, or any chat tool that accepts an incoming webhook. Active alerts, history, silences and announcements sit in one place.
Ask about the page you are on. The assistant reads live cluster, pod, event, log and alert data — with your permissions and read-only. The model comes from the provider you choose, on your own key, so nothing is sent to us. Deep investigations and scheduled reports live in the same layer.
170 audit rules score findings by severity and write a remediation note next to each one. Waste detection lists workloads holding more CPU and memory than they use. Pod incident history keeps OOMKilled, CrashLoop and Evicted events after the pod is gone.
See which service calls which, at what request rate and latency, with failing paths highlighted. Full Istio management sits behind it — gateways, virtual services, authorization policies and a configuration analyser.
CPU, memory, disk, network and process metrics from Windows, Linux and macOS servers — physical or virtual, without installing an agent. Alongside them, HTTP and HTTPS uptime checks with response time and TLS certificate expiry — wired into the same alert lifecycle.
Dashboards for ArgoCD applications and FluxCD reconciliation. A Helm catalogue with Artifact Hub discovery, air-gapped installs, smart upgrade and rollback. Multi-node RKE2 installs over SSH, online or fully offline.
Kubernetes contexts, SSH hosts, Git repositories and credentials in a single hub. Credentials are encrypted at rest and never rendered back to the screen. Role-based access decides who sees which page.
Operations first, then the cluster and server categories underneath.
One command pulls the images and starts the stack.
docker-compose.yml — there is no separate .env file.
Images, stack and installer in one tarball. Download once, carry it in, run one script.
config.env at your own private registry and the installer mirrors everything to it — or run ./install.sh --no-registry straight off the loaded images. Every release ships amd64 and arm64 bundles.
--rollback takes you back to the previous version.
config.env, .env and backups/ are not in it — and the data lives in Docker volumes, untouched.
No. DFZ is a product you install on your own servers; the source is not published. The container images are hosted on ghcr.io and free to pull.
It installs Kubernetes. The RKE2 installer builds a multi-node cluster over SSH, online or fully offline.
Docker and servers are connected, not installed. Docker is then managed — containers, images, networks, logs, terminal. Servers are monitored: processor, memory, disk, network and reachability. Monitoring runs through the operating system, so whether a server is physical or virtual makes no difference.
No. An offline bundle carries the images, the stack and the installer in a single tarball. Nothing is downloaded during installation, so DFZ runs in networks with no route out.
No. DFZ runs on your server and keeps logs, metrics and credentials there. Credentials are encrypted at rest and are never rendered back to the screen. Role-based access decides who can see which page.
Yours. You add the provider and the API key, and you can switch between them. The assistant reads live system data with your permissions, read-only, and the product tells you plainly that its answers should be verified before you act on them.
A host with Docker Compose. Images are published for amd64 and arm64. The stack is Postgres, Redis, the backend, a terminal service and the interface; you reach it on port 3080.
Container images are free on ghcr.io. Read the docs, open an issue.